Oklahoma Math PA.D.1.2
The Standard
- PA.D.1
- Display and interpret data in a variety of ways, including using scatter plots and approximate lines of best fit. Use the line of best fit and average rate of change to make predictions and draw conclusions about data.
Explain how outliers affect measures of center and spread.
Oklahoma Academic Standards for Mathematics (2022)
Teacher's field guide
What This Standard Means
What Students Need to Do
- Students compare a data set before and after adding a value far from the rest. They calculate the mean, median, range, and interquartile range. Then they explain which measures change and why.
What Mastery Looks Like
- For 2, 3, 4, 5, 6 with 30 added, a student finds a new mean of about 8.3, a median of 4.5, and a range of 28. They explain why the mean and range change much more than the median.
Common Misconceptions
- Some students think an outlier always raises the mean, even when it is unusually low. Others expect the median and interquartile range to change as much as the mean and range.
How to Assess It
- Exit ticket: Add 30 to 2, 3, 4, 5, 6. Calculate the mean, median, and range before and after, then explain which measure changes most.
Lesson moves
Ways to Teach It
Place cards labeled 2, 3, 4, 5, 6 on a number line, add 30, then calculate the mean, median, range, and interquartile range.
Write why adding 0 to 10, 12, 14, 16, 18 shifts the mean more than the median.
In pairs, use number cards 2, 3, 4, 5, 6 and additional-value cards 0 and 30; predict which added value changes the mean more, then check.
Compare bus rides of 12, 13, 14, 15, 16, and 45 minutes; choose whether the mean or median better describes a typical ride.
Free download
Printable PA.D.1.2 Worksheet
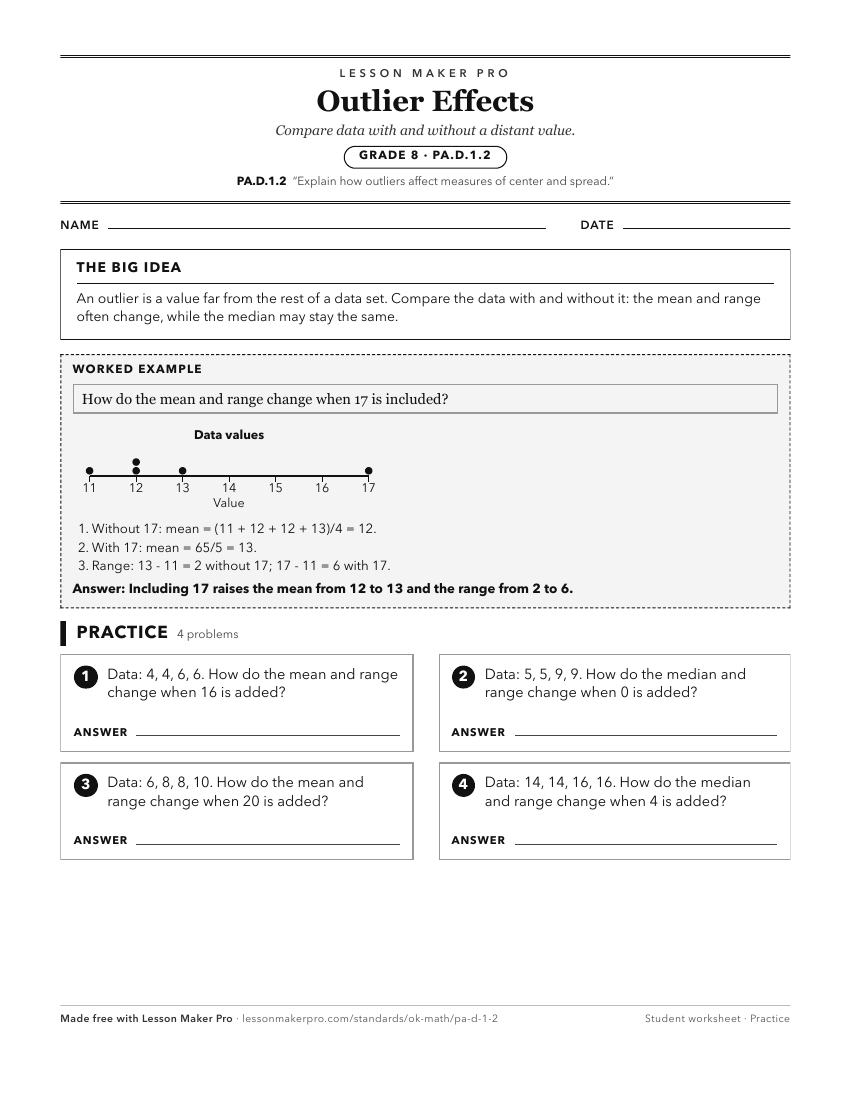
A ready-to-print activity worksheet aligned to PA.D.1.2, with an answer key for the teacher on its own page. No account needed.
PDF, US Letter, prints cleanly in black and white.
Download the worksheetKeep exploring
Related Standards
- 7.D.1.1
Design simple experiments, collect data, and calculate measures of center (mean, median, and mode) and spread (range and interquartile range). Use these quantit...
- 6.D.1.2
Explain and justify which measure of center (mean, median, or mode) would provide the most descriptive information for a given set of data.
- S.DA.1.1
Summarize and represent the distribution for univariate quantitative data by describing and analyzing the shape of the distribution, the measures of center for ...
Turn this exact standard into a lesson
Grade, subject, topic, and the complete standard are prefilled. Create one free, no account needed.
Also for this standard:Make a WorksheetMake a QuizMake a Sub Lesson