Oklahoma Math 7.D.1.1
The Standard
- 7.D.1
- Interpret and analyze data, creating the most appropriate display, using a variety of tools.
Design simple experiments, collect data, and calculate measures of center (mean, median, and mode) and spread (range and interquartile range). Use these quantities to draw conclusions about the data collected and make predictions.
Oklahoma Academic Standards for Mathematics (2022)
Teacher's field guide
What This Standard Means
What Students Need to Do
- Students plan a fair test, collect repeated measurements, and put the results in a useful display. They find the mean, median, mode, range, and IQR. They use those numbers to describe the results and predict another result.
What Mastery Looks Like
- A student changes one factor while keeping other conditions the same. They calculate each measure correctly and use the center and spread to explain which results are more consistent.
Common Misconceptions
- Students may change several conditions between trials, making the results hard to compare. They may call the largest value the mode or assume every data set has one. They may calculate IQR as the full range instead of subtracting the lower quartile from the upper quartile.
How to Assess It
- Exit ticket: Eight paper airplane flights measured 2, 2, 4, 4, 4, 4, 6, and 6 feet. Find the mean, median, mode, range, and IQR, then predict the next flight distance and explain your choice.
Lesson moves
Ways to Teach It
Build paper helicopters with two wing lengths, drop each eight times from the same height, and record fall times with a stopwatch.
Show two dot plots with equal medians but different IQRs; ask, "Which setup gives more consistent results, and how can you tell?"
Give pairs cards with eight trial results; have them calculate all five measures, then swap papers to check their work.
Time eight cafeteria line waits, then use the median and IQR to predict another student's wait.
Free download
Printable 7.D.1.1 Worksheet
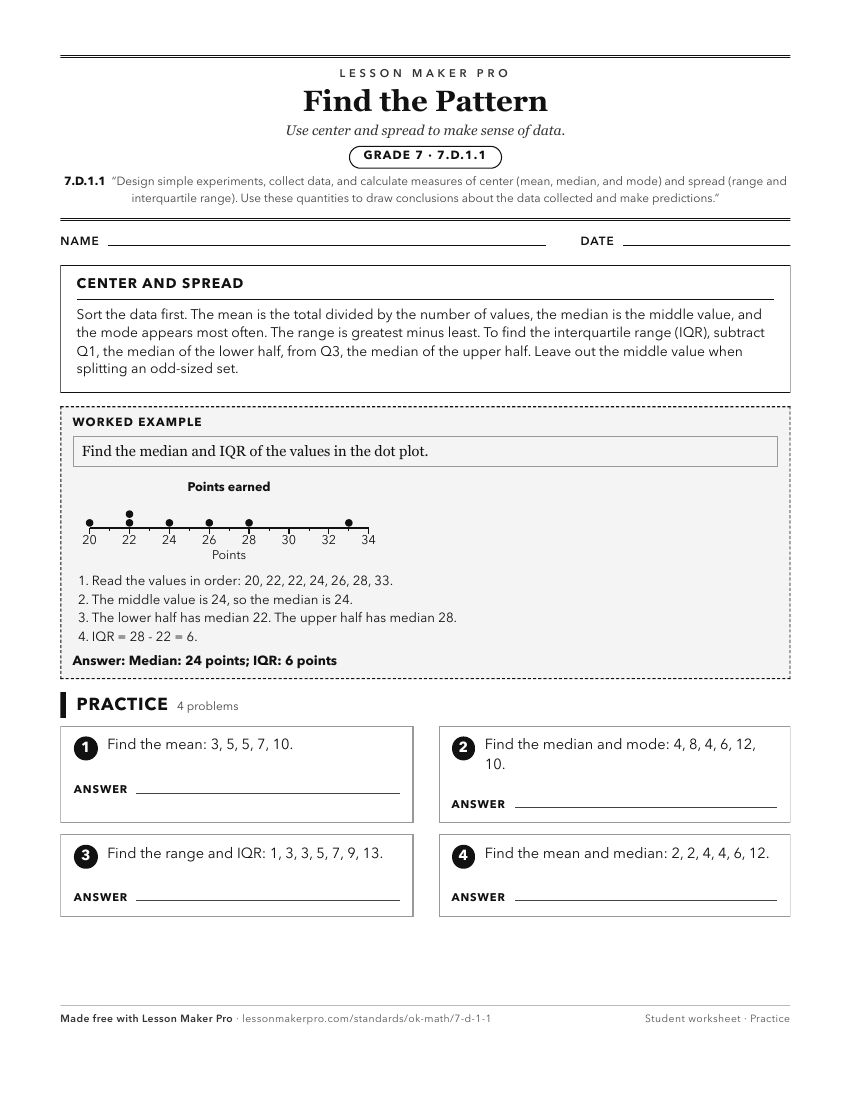
A ready-to-print activity worksheet aligned to 7.D.1.1, with an answer key for the teacher on its own page. No account needed.
PDF, US Letter, prints cleanly in black and white.
Download the worksheetKeep exploring
Related Standards
- 5.D.1
Create and analyze data to find the range and measures of central tendency (mean, median, mode).
- A1.D.1.1
Display, describe, and compare data sets using summary statistics (central tendency and spread (range)). Utilize technology (e.g., spreadsheets, calculators) to...
- 5.D.1.1
Find the measures of central tendency (i.e., mean, median, mode) and range of a set of data. Understand that the mean is a "leveling out" or central balance poi...
- 6.D.1.1
Interpret the mean, median, and mode for a set of data.
Turn this exact standard into a lesson
Grade, subject, topic, and the complete standard are prefilled. Create one free, no account needed.
Also for this standard:Make a WorksheetMake a QuizMake a Sub Lesson