Oklahoma Math 5.D.1
Standard Cluster
Create and analyze data to find the range and measures of central tendency (mean, median, mode). Find the measures of central tendency (i.e., mean, median, mode) and range of a set of data. Understand that the mean is a “leveling out” or central balance point of the data. Create and analyze line and double-bar graphs with increments of whole numbers, fractions, and decimals.
Oklahoma Academic Standards for Mathematics (2022)
Cluster contents
Standards in This Cluster
5.D.1 is a cluster heading. These are the individual standards under it.
Teacher's field guide
What This Cluster Means
What Students Need to Do
- Students collect data and draw line and double-bar graphs with whole-number, fraction, or decimal scales. They read the graphs and find the mean, median, mode, and range. They show how the mean levels out the values.
What Mastery Looks Like
- Students find each measure correctly, even when the mean is not a value in the set. They use equal intervals on a graph, pair bars by category, and explain how high and low values balance around the mean.
Common Misconceptions
- Students may find the median without sorting, report the largest value as the range, or mistake it for the mode. They may divide by the number of different values instead of the number of data points. On graphs, they may count each grid line as one unit when the scale steps by 0.5 or 1/4.
How to Assess It
- Plot Monday through Friday rainfall, 0.25, 0.5, 0.5, 0.75, and 1 inch, on a line graph with 0.25-inch steps. Find the mean, median, mode, and range.
Lesson moves
Ways to Teach It
Give groups cube towers of 2, 4, 4, and 10; have them move cubes until all four towers are 5 high.
Ask, "For 2, 4, 4, 10, why is the mean 5 but the median 4? Which describes most towers better?"
Give pairs two runners' lap times, (1, 1.5, 2) and (1.5, 2, 2.5) minutes; race to draw double-bar graphs with 0.5 steps.
Use last week's daily high temperatures from a weather app; plot a line graph with one-degree steps and describe the trend.
Free download
Printable 5.D.1 Worksheet
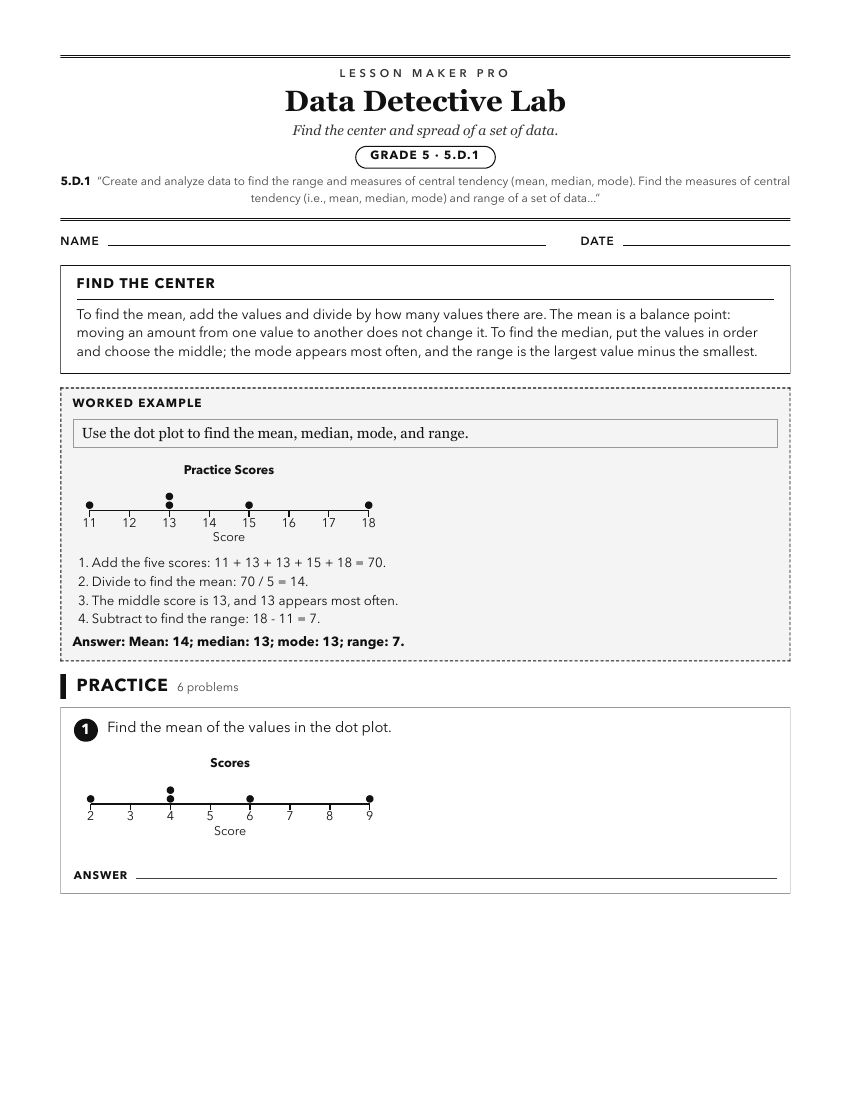
A ready-to-print activity worksheet aligned to 5.D.1, with an answer key for the teacher on its own page. No account needed.
PDF, US Letter, prints cleanly in black and white.
Download the worksheetKeep exploring
Related Standards
- 7.D.1.1
Design simple experiments, collect data, and calculate measures of center (mean, median, and mode) and spread (range and interquartile range). Use these quantit...
- 6.D.1.1
Interpret the mean, median, and mode for a set of data.
- A1.D.1.1
Display, describe, and compare data sets using summary statistics (central tendency and spread (range)). Utilize technology (e.g., spreadsheets, calculators) to...
Turn this cluster into a lesson
Grade, subject, topic, and the complete cluster are prefilled. Create one free, no account needed.
Also for this cluster:Make a WorksheetMake a QuizMake a Sub Lesson