Oklahoma Math A1.D.1.1
The Standard
- A1.D.1
- Display, describe, and compare data. For linear relationships, make predictions, and assess the reliability of those predictions.
Display, describe, and compare data sets using summary statistics (central tendency and spread (range)). Utilize technology (e.g., spreadsheets, calculators) to display data and calculate summary statistics.
Oklahoma Academic Standards for Mathematics (2022)
Teacher's field guide
What This Standard Means
What Students Need to Do
- Students graph two data sets and use a spreadsheet or calculator to find the mean, median, mode when there is one, and range. They use the graphs and numbers to compare typical values and spread.
What Mastery Looks Like
- A student makes matching dot plots and calculates the summary values correctly. They can explain that two groups may have the same median but different ranges, and that an unusually high value can pull up the mean.
Common Misconceptions
- Students may call the largest value the range instead of subtracting the smallest value. They may assume the mean is always typical, even when one unusual value pulls it away from most of the data. Some think every data set has a mode.
How to Assess It
- Exit ticket: Compare A = 10, 10, 12, 14, 14 and B = 8, 10, 12, 14, 16. Draw dot plots, use a calculator to find each mean and median, list any modes, and find each range. Which set varies more?
Lesson moves
Ways to Teach It
Give pairs score cards for A (6, 7, 7, 8, 10) and B (4, 7, 7, 9, 11); have them build paper dot plots.
Ask students to write why 10, 12, 14 is more consistent than 4, 12, 20, though both groups have a median of 12.
Play spreadsheet error hunt: enter 3, 4, 4, 5; show range as MAX(A1:A4); have students correct the formula.
Time five volunteers walking two hallway routes, then enter the times in a spreadsheet to compare mean travel times and ranges.
Free download
Printable A1.D.1.1 Worksheet
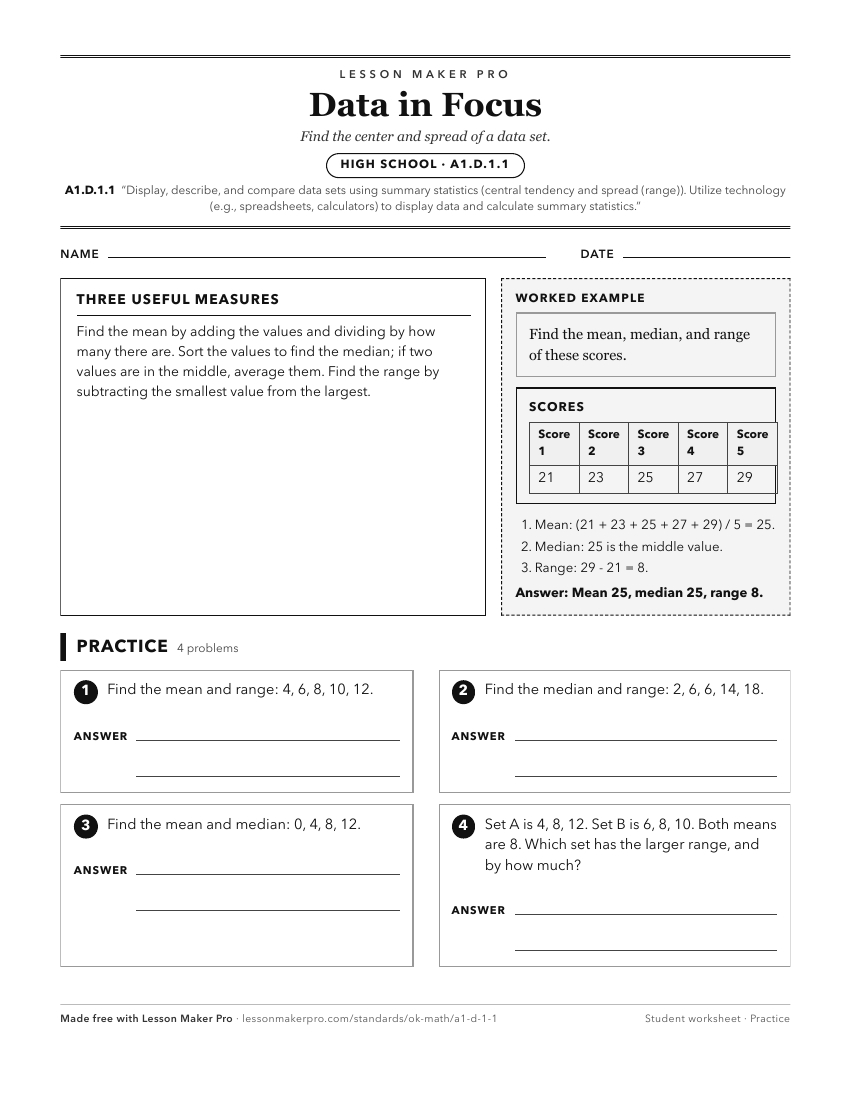
A ready-to-print activity worksheet aligned to A1.D.1.1, with an answer key for the teacher on its own page. No account needed.
PDF, US Letter, prints cleanly in black and white.
Download the worksheetKeep exploring
Related Standards
- 7.D.1.1
Design simple experiments, collect data, and calculate measures of center (mean, median, and mode) and spread (range and interquartile range). Use these quantit...
- 5.D.1
Create and analyze data to find the range and measures of central tendency (mean, median, mode).
- A1.D.1
Display, describe, and compare data. For linear relationships, make predictions, and assess the reliability of those predictions.
- A2.D.1
Display, describe, and compare data. For linear and nonlinear relationships, make predictions and assess the reliability of those predictions.
Turn this exact standard into a lesson
Grade, subject, topic, and the complete standard are prefilled. Create one free, no account needed.
Also for this standard:Make a WorksheetMake a QuizMake a Sub Lesson