Oklahoma Math A2.D.1
Standard Cluster
Display, describe, and compare data. For linear and nonlinear relationships, make predictions and assess the reliability of those predictions. Use the mean and standard deviation of a data set to create a normal distribution (bell-shaped curve). Collect data and use scatter plots to analyze patterns and describe linear, exponential, or quadratic relationships between two variables. Make predictions based upon the regression equation (linear, exponential, or quadratic), and use the correlation coefficient to assess the reliability of those predictions using graphing technology.
Oklahoma Academic Standards for Mathematics (2022)
Cluster contents
Standards in This Cluster
A2.D.1 is a cluster heading. These are the individual standards under it.
- A2.D.1.1
Use the mean and standard deviation of a data set to create a normal distribution (bell-shaped curve).
- A2.D.1.2
Collect data and use scatter plots to analyze patterns and describe linear, exponential, or quadratic relationships between two variables.
- A2.D.1.3
Make predictions based upon the regression equation (linear, exponential, or quadratic), and use the correlation coefficient to assess the reliability of those ...
Teacher's field guide
What This Cluster Means
What Students Need to Do
- Students plot and compare data, then describe whether paired values follow a line, an exponential curve, or a parabola. They use regression equations to predict values and check how well the model fits. For roughly bell-shaped data, they use the mean and standard deviation to draw a normal curve.
What Mastery Looks Like
- A student can choose a model from a scatter plot and explain the pattern in words. They can predict from its equation, use r to judge a linear fit or R² to judge a curved fit, and flag predictions beyond the data. They can mark the mean and standard deviations on a bell curve.
Common Misconceptions
- Students may call any upward trend linear, even when the points bend. They may treat a high correlation as proof of cause or trust predictions far beyond the measured values. They may draw a bell curve for skewed data or confuse standard deviation with range.
How to Assess It
- Exit ticket: Plot (0, 2), (1, 3), (2, 6), (3, 11), (4, 18) in Desmos. Fit linear and quadratic models, compare their plots and R² values, then predict at 5 and name one limit of that prediction.
Lesson moves
Ways to Teach It
Measure classmates' heights and arm spans, plot the pairs, then use the heights' mean and standard deviation to sketch a bell curve.
Show a curved scatter plot with a high linear r value; ask students to write why the line still misses the pattern.
Give groups three data cards showing steady growth, doubling, and an arch; plot each in Desmos and select a regression model.
Collect used-car prices by age from local listings, fit an exponential model, and estimate the price of a five-year-old car.
Free download
Printable A2.D.1 Worksheet
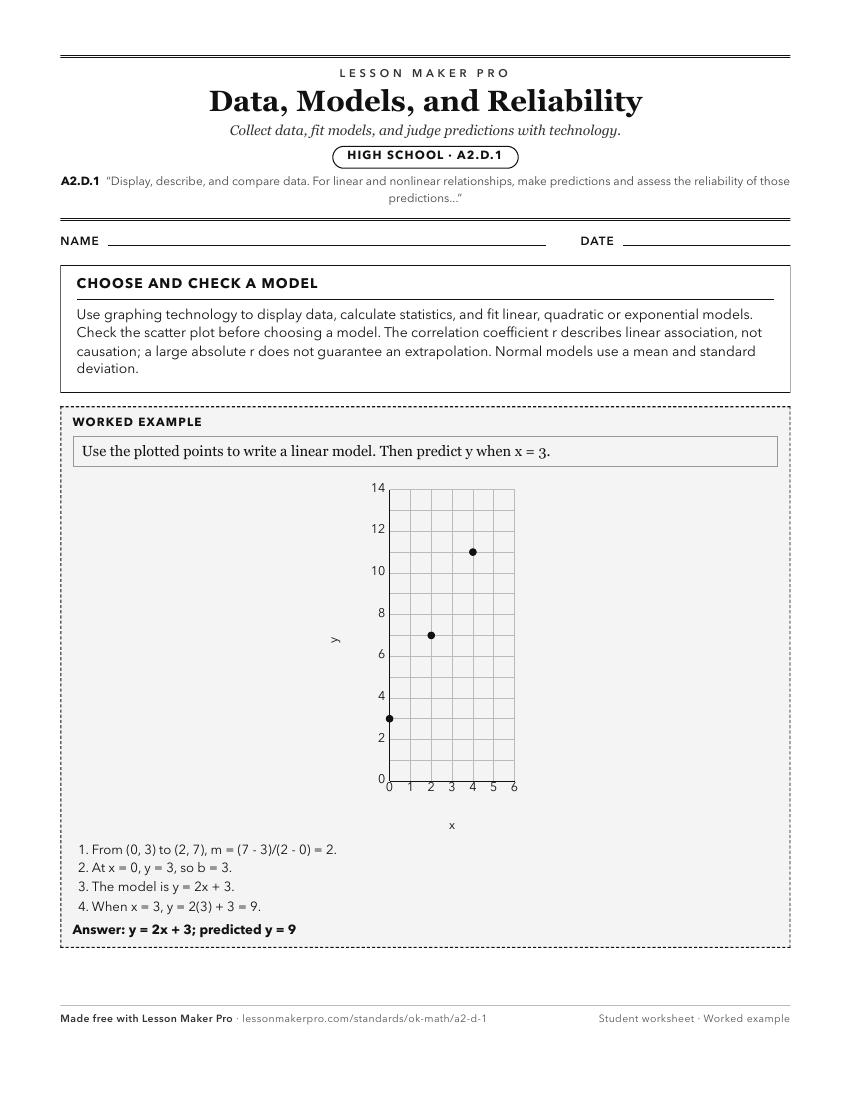
A ready-to-print activity worksheet aligned to A2.D.1, with an answer key for the teacher on its own page. No account needed.
PDF, US Letter, prints cleanly in black and white.
Download the worksheetKeep exploring
Related Standards
- A1.D.1
Display, describe, and compare data. For linear relationships, make predictions, and assess the reliability of those predictions.
- PA.D.1
Display and interpret data in a variety of ways, including using scatter plots and approximate lines of best fit. Use the line of best fit and average rate of c...
- PA.A.2.2
Identify, describe, and analyze linear relationships between two variables.
Turn this cluster into a lesson
Grade, subject, topic, and the complete cluster are prefilled. Create one free, no account needed.
Also for this cluster:Make a WorksheetMake a QuizMake a Sub Lesson