Oklahoma Math A2.D.1.3
The Standard
- A2.D.1
- Display, describe, and compare data. For linear and nonlinear relationships, make predictions and assess the reliability of those predictions.
Make predictions based upon the regression equation (linear, exponential, or quadratic), and use the correlation coefficient to assess the reliability of those predictions using graphing technology.
Oklahoma Academic Standards for Mathematics (2022)
Teacher's field guide
What This Standard Means
What Students Need to Do
- Students enter paired data into a graphing tool and fit a linear, exponential, or quadratic equation. They use the equation to make a prediction, then check the graph and fit before trusting it.
What Mastery Looks Like
- A student chooses a model that matches the shape of the data and makes a prediction from its equation. They use r to judge a linear fit, check residuals for a curved fit, and flag predictions far outside the measured range.
Common Misconceptions
- Students may think an r near zero means no pattern exists, even when the graph is U-shaped. They may also treat a strong fit as proof that a prediction far beyond the data is accurate.
How to Assess It
- Give students (1, 3), (2, 5), (3, 7), (4, 9), and (5, 11). Ask them to fit a line with a graphing tool, report r, predict y at x = 6, and explain why a prediction at x = 60 is less trustworthy.
Lesson moves
Ways to Teach It
Stack 10, 20, 30, 40, and 50 index cards, measure each stack, fit a line, and predict the thickness of 60 cards.
Graph (1, 9), (2, 4), (3, 1), (4, 4), (5, 9); ask why r is zero despite the clear pattern.
Pairs enter x = 1 to 5 with y-lists 2,4,6,8,10; 1,4,9,16,25; 2,4,8,16,32. Fit three models and predict at x = 3.5.
Use car prices at ages 1 to 5: $24k, $20k, $17k, $14k, $12k; fit an exponential curve and predict age 6.
Free download
Printable A2.D.1.3 Worksheet
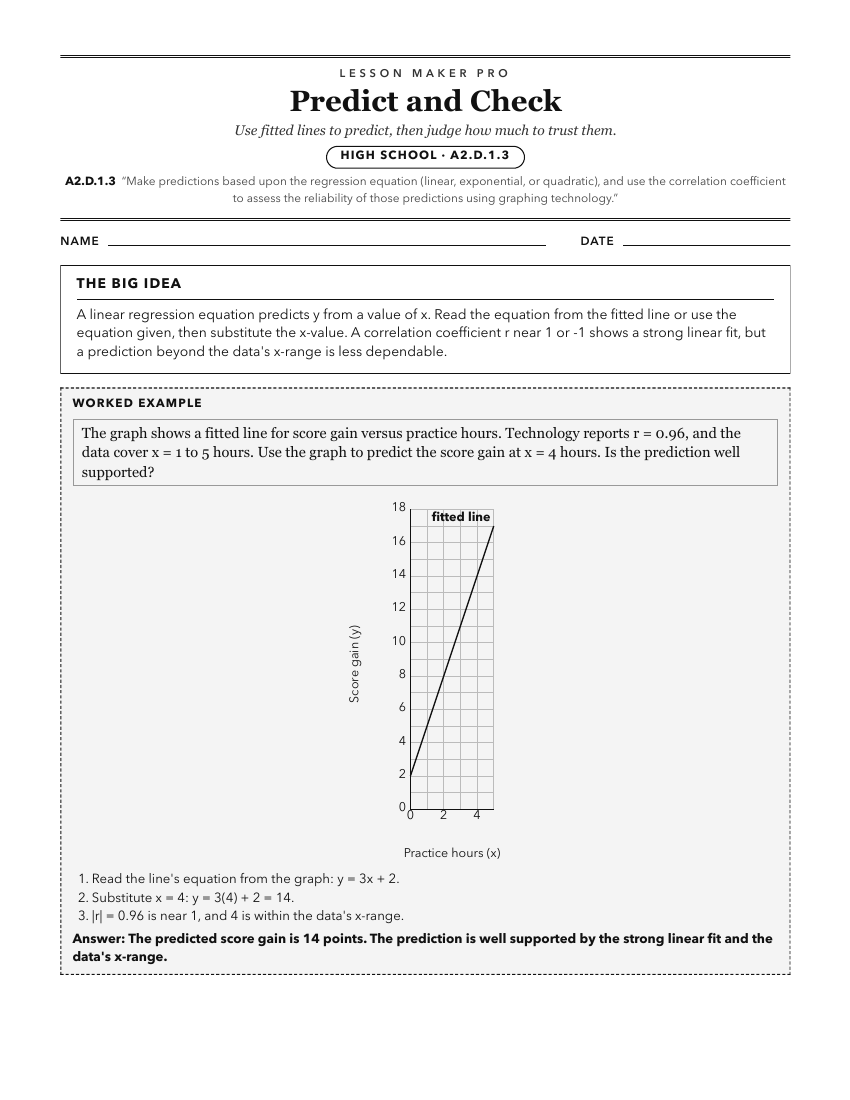
A ready-to-print activity worksheet aligned to A2.D.1.3, with an answer key for the teacher on its own page. No account needed.
PDF, US Letter, prints cleanly in black and white.
Download the worksheetKeep exploring
Related Standards
- A1.D.1.3
Make predictions based upon the linear regression, and use the correlation coefficient to assess the reliability of those predictions using graphing technology.
- S.DA.4.2
Make predictions and draw conclusions from regression models (linear, exponential, quadratic) from two-variable quantitative data.
- A1.D.1
Display, describe, and compare data. For linear relationships, make predictions, and assess the reliability of those predictions.
- S.DA.4.4
Using technology, compute and interpret the correlation coefficient.
Turn this exact standard into a lesson
Grade, subject, topic, and the complete standard are prefilled. Create one free, no account needed.
Also for this standard:Make a WorksheetMake a QuizMake a Sub Lesson