Oklahoma Math S.DA.4.2
The Standard
- S.DA.4
- Analyze associations between two variables.
Make predictions and draw conclusions from regression models (linear, exponential, quadratic) from two-variable quantitative data.
Oklahoma Academic Standards for Mathematics (2022)
Teacher's field guide
What This Standard Means
What Students Need to Do
- Students use linear, exponential, and quadratic models to predict values from paired data. They describe the pattern each model shows and decide whether a prediction is reasonable.
What Mastery Looks Like
- A student chooses a model that follows the points on a scatterplot. They calculate a prediction, include units, and explain why a prediction far beyond the data may be unreliable.
Common Misconceptions
- Students may choose a line for data that grows by a constant percent. They may think a quadratic keeps rising after its peak. They may treat predictions far beyond the measured data as certain.
How to Assess It
- Exit ticket: A bacteria culture follows P(t) = 100(1.5)^t, where t is days, and data was collected through day 5. Predict day 4, describe the trend, and explain whether day 40 is a sound prediction.
Lesson moves
Ways to Teach It
Give pairs measured ball heights at several times and a graphing tool; fit a quadratic and test its prediction against one hidden measurement.
Show two models for club membership, one linear and one exponential; ask students which better matches a scatterplot and why.
Have students match six scatterplots to linear, exponential, or quadratic equations, then calculate one predicted value for each match.
Show monthly food delivery orders of 50, 60, 72, and 86; fit an exponential model and estimate next month’s orders.
Free download
Printable S.DA.4.2 Worksheet
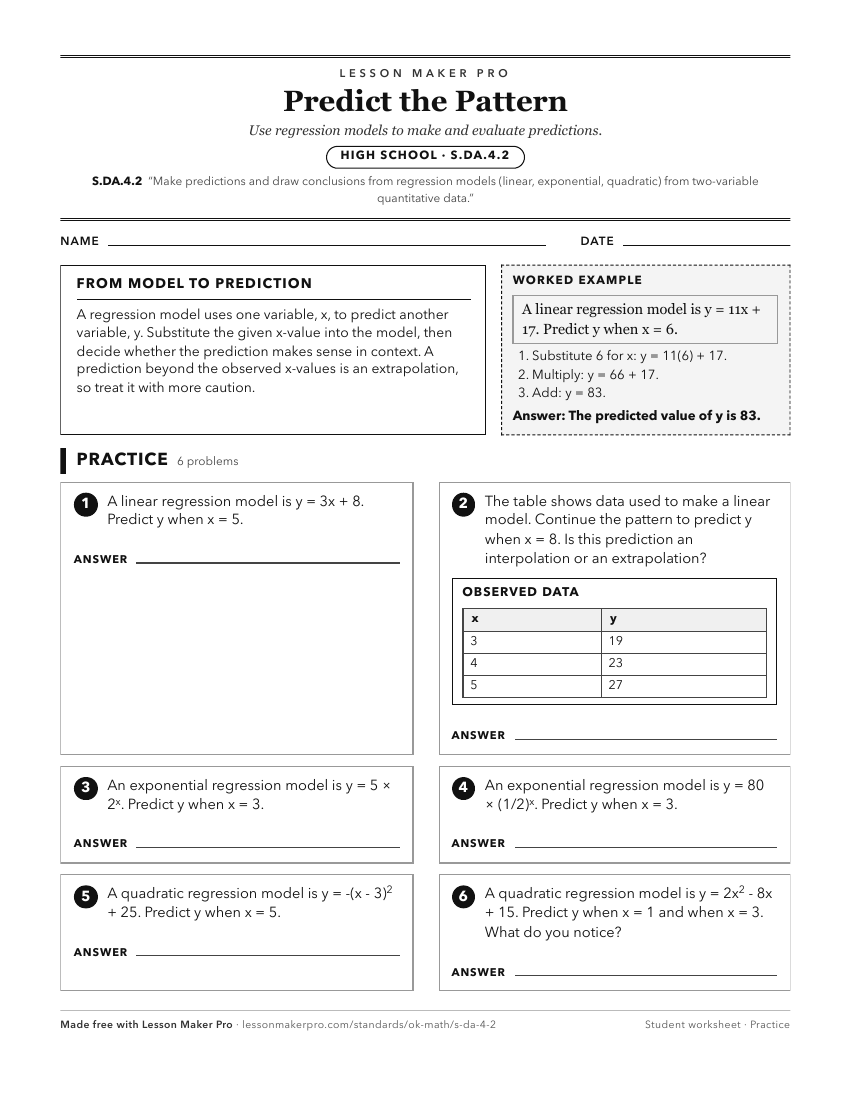
A ready-to-print activity worksheet aligned to S.DA.4.2, with an answer key for the teacher on its own page. No account needed.
PDF, US Letter, prints cleanly in black and white.
Download the worksheetKeep exploring
Related Standards
- A2.D.1.3
Make predictions based upon the regression equation (linear, exponential, or quadratic), and use the correlation coefficient to assess the reliability of those ...
- A2.D.1.2
Collect data and use scatter plots to analyze patterns and describe linear, exponential, or quadratic relationships between two variables.
- A2.D.1
Display, describe, and compare data. For linear and nonlinear relationships, make predictions and assess the reliability of those predictions.
- A1.D.1
Display, describe, and compare data. For linear relationships, make predictions, and assess the reliability of those predictions.
Turn this exact standard into a lesson
Grade, subject, topic, and the complete standard are prefilled. Create one free, no account needed.
Also for this standard:Make a WorksheetMake a QuizMake a Sub Lesson