Oklahoma Math A1.D.1.3
The Standard
- A1.D.1
- Display, describe, and compare data. For linear relationships, make predictions, and assess the reliability of those predictions.
Make predictions based upon the linear regression, and use the correlation coefficient to assess the reliability of those predictions using graphing technology.
Oklahoma Academic Standards for Mathematics (2022)
Teacher's field guide
What This Standard Means
What Students Need to Do
- Students enter paired data into a graphing tool and find a regression line and correlation coefficient. They use the line to predict a value, then check the scatterplot and data range to judge how much to trust it.
What Mastery Looks Like
- A student uses the regression equation to make a prediction with units. They know an r near 1 or -1 shows a strong linear pattern, not an exact prediction. They are cautious when predicting beyond the data range.
Common Misconceptions
- Students may treat a negative r as weak even when it is near -1. They may assume a strong correlation guarantees an exact answer or use the line far beyond the data range.
How to Assess It
- Have students enter (1, 2), (2, 3), (3, 5), (4, 4), and (5, 6) into a graphing calculator. Ask for the regression line, r, a prediction at x = 4.5, and one reason a prediction at x = 10 is less dependable.
Lesson moves
Ways to Teach It
Pairs graph hours (1, 2, 3, 4, 5) and scores (58, 63, 71, 74, 82) in Desmos, fit a line, and predict at 3.5 hours.
Ask, “Which suggests a tighter linear pattern, r = 0.92 or r = -0.96? Explain without using the sign alone.”
Hand out cards marked r = 0.2, -0.5, and 0.95; teams rank their in-range prediction reliability and defend the order.
For a café, graph temperatures (65, 70, 75, 80, 85°F) against iced drinks sold (20, 25, 32, 37, 41); compare predictions at 78°F and 110°F.
Free download
Printable A1.D.1.3 Worksheet
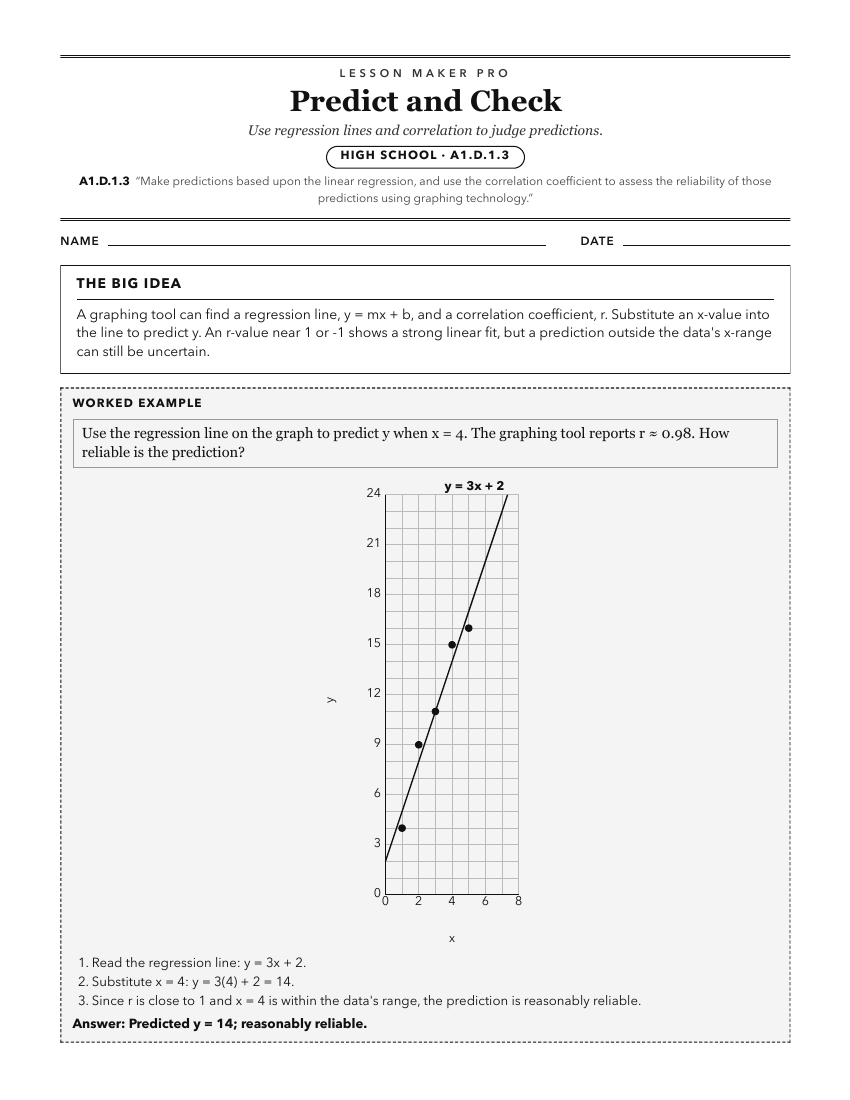
A ready-to-print activity worksheet aligned to A1.D.1.3, with an answer key for the teacher on its own page. No account needed.
PDF, US Letter, prints cleanly in black and white.
Download the worksheetKeep exploring
Related Standards
- A2.D.1.3
Make predictions based upon the regression equation (linear, exponential, or quadratic), and use the correlation coefficient to assess the reliability of those ...
- S.DA.4.4
Using technology, compute and interpret the correlation coefficient.
- A1.D.1
Display, describe, and compare data. For linear relationships, make predictions, and assess the reliability of those predictions.
- A2.D.1
Display, describe, and compare data. For linear and nonlinear relationships, make predictions and assess the reliability of those predictions.
Turn this exact standard into a lesson
Grade, subject, topic, and the complete standard are prefilled. Create one free, no account needed.
Also for this standard:Make a WorksheetMake a QuizMake a Sub Lesson