Oklahoma Math A2.D.1.1
The Standard
- A2.D.1
- Display, describe, and compare data. For linear and nonlinear relationships, make predictions and assess the reliability of those predictions.
Use the mean and standard deviation of a data set to create a normal distribution (bell-shaped curve).
Oklahoma Academic Standards for Mathematics (2022)
Teacher's field guide
What This Standard Means
What Students Need to Do
- Students find the mean and standard deviation of a data set. They use those numbers to draw a bell curve, with the mean at the center and standard deviations marked on both sides. They check whether the data are roughly bell shaped before using the curve as a model.
What Mastery Looks Like
- A student puts the peak over the mean and marks one, two, and three standard deviations in equal steps on each side. They draw a symmetric curve with the right spread and know that about 68% of values fall within one standard deviation.
Common Misconceptions
- Students may put the mean at the left end of the axis or treat standard deviation as the height of the curve rather than its spread. Some assume every data set fits a bell curve, even when the values are skewed or form two clusters.
How to Assess It
- A roughly bell-shaped set of package weights has a mean of 70 grams and a standard deviation of 5 grams. Have students sketch its normal curve, label 60, 65, 70, 75, and 80 grams, and circle the interval containing about 68% of values.
Lesson moves
Ways to Teach It
Give pairs 20 roughly symmetric measurement cards; have them calculate the mean and standard deviation with a calculator, then label a bell curve.
Show two bell curves centered at 50, with standard deviations of 5 and 15; ask which predicts more values between 45 and 55.
Run a curve match: students pair four data summaries with four bell curves that have different centers and spreads, then explain each match.
Give students package weights from one filling machine; have them mark the mean and two standard deviations to spot unusually light packages.
Free download
Printable A2.D.1.1 Worksheet
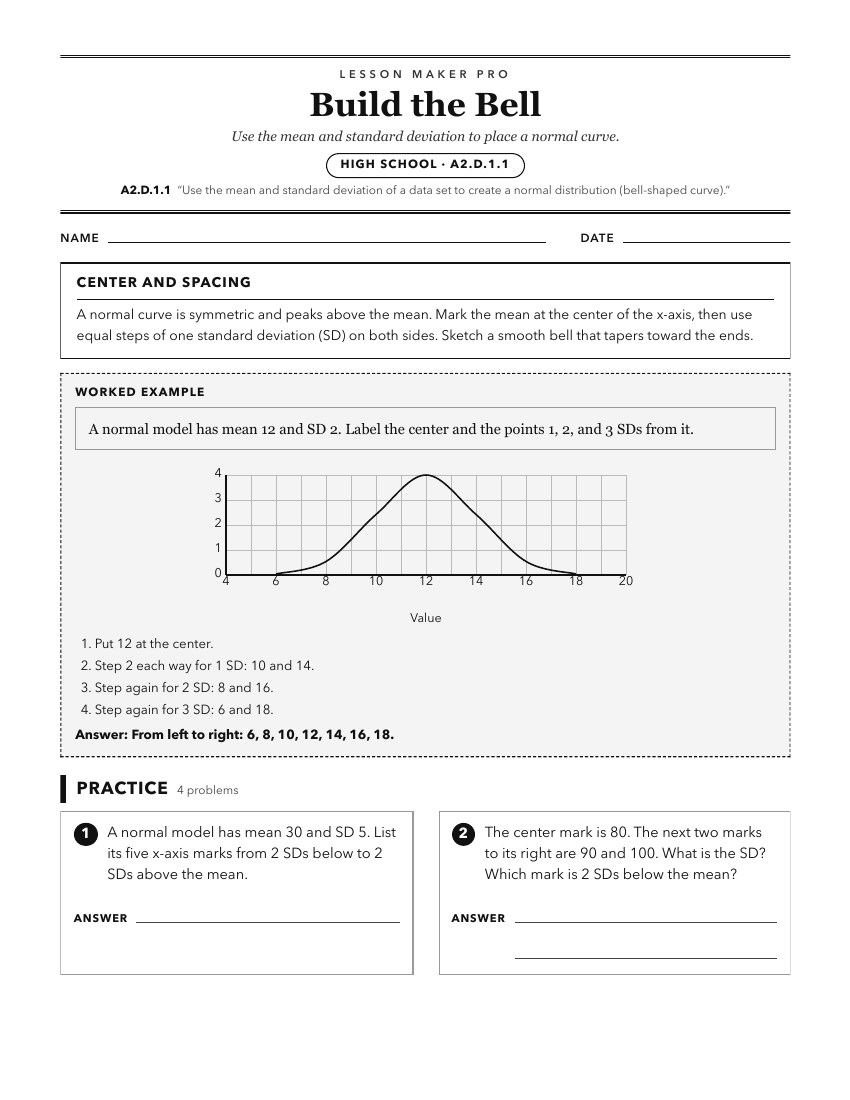
A ready-to-print activity worksheet aligned to A2.D.1.1, with an answer key for the teacher on its own page. No account needed.
PDF, US Letter, prints cleanly in black and white.
Download the worksheetKeep exploring
Related Standards
- S.DA.2
Use the mean and standard deviation of a data set to fit it to a normal distribution and to estimate population percentages.
- 7.D.1.1
Design simple experiments, collect data, and calculate measures of center (mean, median, and mode) and spread (range and interquartile range). Use these quantit...
- S.DA.2.1
Use calculators, computers, or tables to estimate areas under the normal curve. Recognize that there are data sets for which such a procedure is not appropriate...
- 5.D.1
Create and analyze data to find the range and measures of central tendency (mean, median, mode).
Turn this exact standard into a lesson
Grade, subject, topic, and the complete standard are prefilled. Create one free, no account needed.
Also for this standard:Make a WorksheetMake a QuizMake a Sub Lesson