Oklahoma Math S.DA.2.1
The Standard
- S.DA.2
- Use the mean and standard deviation of a data set to fit it to a normal distribution and to estimate population percentages.
Use calculators, computers, or tables to estimate areas under the normal curve. Recognize that there are data sets for which such a procedure is not appropriate.
Oklahoma Academic Standards for Mathematics (2022)
Teacher's field guide
What This Standard Means
What Students Need to Do
- Students find the mean and standard deviation of a data set. They use a calculator or normal table to estimate percentages within a range, but only when the data are roughly bell-shaped.
What Mastery Looks Like
- Given roughly bell-shaped test scores, a student estimates the percent above a cutoff and explains what that percent means. They reject a normal model for data with strong skew or two peaks.
Common Misconceptions
- Students may assume every data set is bell-shaped. They may find the area below a cutoff when asked for the area above it, or apply normal-curve percentages to skewed data.
How to Assess It
- Exit ticket: Adult heights are roughly bell-shaped, with a mean of 170 cm and a standard deviation of 10 cm. Use a calculator to estimate the percent between 160 and 180 cm, then explain why the same method may not work for strongly skewed incomes.
Lesson moves
Ways to Teach It
Give pairs 30 printed height measurements and sticky notes; have them build a dot plot, mark the mean and standard deviation, and judge its shape.
Show histograms of adult heights and household incomes; ask, “Which could use a normal curve to estimate percentages, and what shape tells you?”
Play cutoff bingo with cards showing percentages; call score cutoffs for a normal model with a mean of 70 and standard deviation of 8.
Give students a bolt-length histogram, mean, standard deviation, and allowed range; have them check the shape and estimate the percent that fail inspection.
Free download
Printable S.DA.2.1 Worksheet
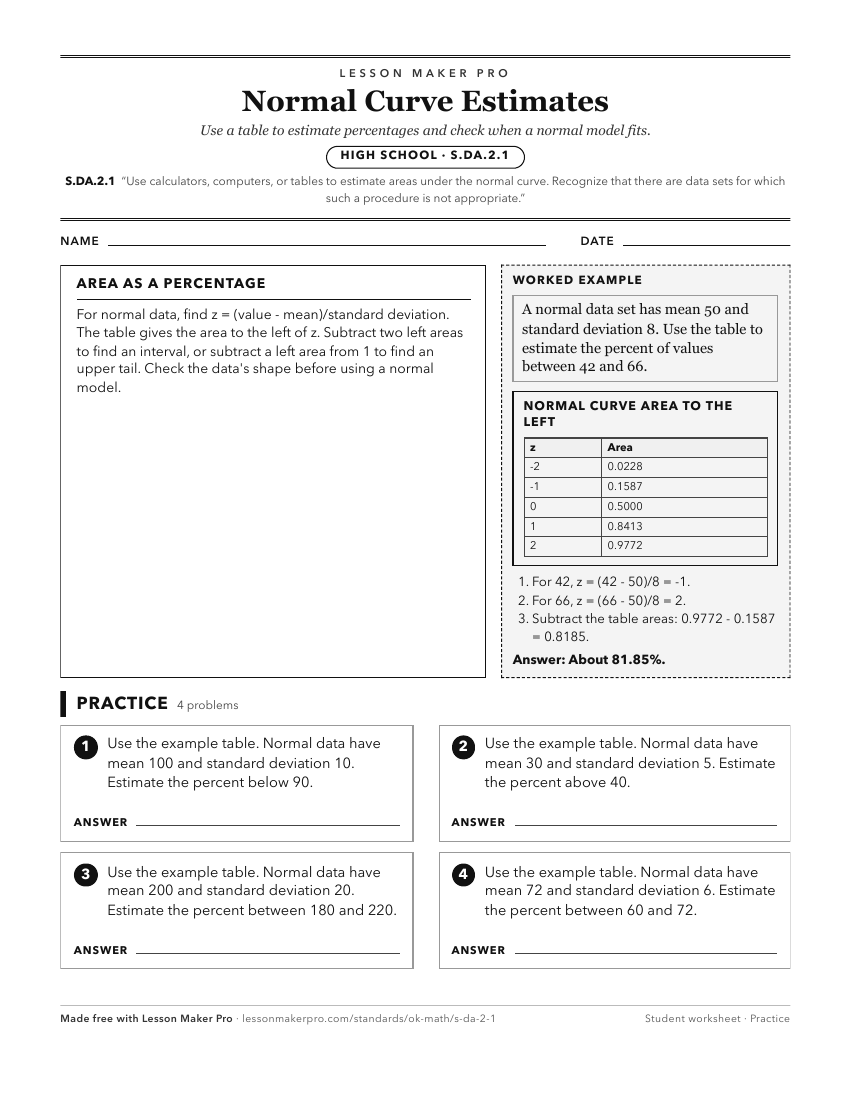
A ready-to-print activity worksheet aligned to S.DA.2.1, with an answer key for the teacher on its own page. No account needed.
PDF, US Letter, prints cleanly in black and white.
Download the worksheetKeep exploring
Related Standards
- S.DA.2
Use the mean and standard deviation of a data set to fit it to a normal distribution and to estimate population percentages.
- A2.D.1.1
Use the mean and standard deviation of a data set to create a normal distribution (bell-shaped curve).
- A1.D.1.1
Display, describe, and compare data sets using summary statistics (central tendency and spread (range)). Utilize technology (e.g., spreadsheets, calculators) to...
- 7.D.1.1
Design simple experiments, collect data, and calculate measures of center (mean, median, and mode) and spread (range and interquartile range). Use these quantit...
Turn this exact standard into a lesson
Grade, subject, topic, and the complete standard are prefilled. Create one free, no account needed.
Also for this standard:Make a WorksheetMake a QuizMake a Sub Lesson