Oklahoma Math S.DA.2
Standard Cluster
Use the mean and standard deviation of a data set to fit it to a normal distribution and to estimate population percentages. Use calculators, computers, or tables to estimate areas under the normal curve. Recognize that there are data sets for which such a procedure is not appropriate.
Oklahoma Academic Standards for Mathematics (2022)
Cluster contents
Standards in This Cluster
S.DA.2 is a cluster heading. These are the individual standards under it.
Teacher's field guide
What This Cluster Means
What Students Need to Do
- Students check whether a data set is roughly bell-shaped. They use its mean and standard deviation with a calculator or table to estimate the percentage of values above, below, or between given numbers.
What Mastery Looks Like
- A student can place a normal curve over a roughly symmetric, single-peaked histogram using the mean and standard deviation. They find the correct area under the curve, report it as a percentage, and reject the model for strongly skewed data.
Common Misconceptions
- Students may assume every data set fits a bell curve, even one with a long tail or two peaks. They may report the area left of a cutoff when asked for the area right of it.
How to Assess It
- Exit ticket: Test scores have a mean of 70, a standard deviation of 10, and a bell-shaped histogram. Use a normal calculator to estimate the percentage above 80, then explain whether you would use the same method for a sharply right-skewed salary histogram.
Lesson moves
Ways to Teach It
Place score cards 60, 65, 70, 70, 75, 75, 80, 80, 80, 85, 85, 90, 90, 95, 100 in a dot plot and mark the mean.
Show a symmetric quiz-score histogram and a right-skewed income histogram; ask, "Which can a normal curve model, and why?"
Run a calculator race: with mean 80 and standard deviation 10, find percentages below 70, above 90, and between 70 and 90.
For bell-shaped package weights with mean 500 g and standard deviation 5 g, estimate the percentage of packages weighing less than 490 g.
Free download
Printable S.DA.2 Worksheet
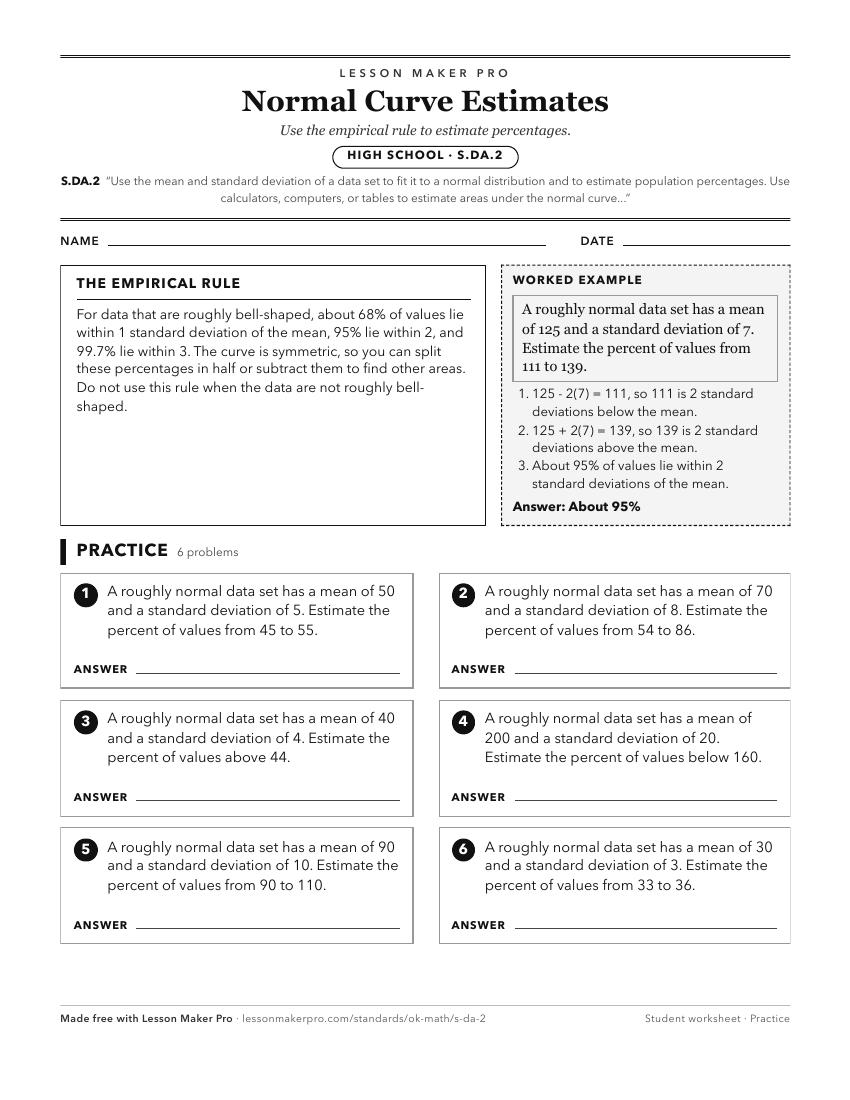
A ready-to-print activity worksheet aligned to S.DA.2, with an answer key for the teacher on its own page. No account needed.
PDF, US Letter, prints cleanly in black and white.
Download the worksheetKeep exploring
Related Standards
- A2.D.1.1
Use the mean and standard deviation of a data set to create a normal distribution (bell-shaped curve).
- S.DA.5.1
Construct and interpret confidence intervals for the mean of a normally distributed population and for a population proportion.
- S.DA.5.4
Construct a confidence interval for the mean of a normally distributed population (with a known standard deviation) and for a population proportion. Use confide...
Turn this cluster into a lesson
Grade, subject, topic, and the complete cluster are prefilled. Create one free, no account needed.
Also for this cluster:Make a WorksheetMake a QuizMake a Sub Lesson