Oklahoma Math S.DA.5.1
The Standard
- S.DA.5
- Make statistical inferences and evaluate claims from studies.
Construct and interpret confidence intervals for the mean of a normally distributed population and for a population proportion.
Oklahoma Academic Standards for Mathematics (2022)
Teacher's field guide
What This Standard Means
What Students Need to Do
- Students use sample data to calculate confidence intervals for a mean from a normal population and for a population proportion. They choose the right standard error and critical value, then explain each interval in context.
What Mastery Looks Like
- Students check that the sample and interval method fit the problem. They calculate both types of interval and label the population value each one estimates. They explain that 95% of intervals made from repeated samples would contain the true value.
Common Misconceptions
- Students may use the proportion formula for a mean, or use z instead of t when only the sample standard deviation is known. They may say that 95% of individual data values fall inside the interval, or that this particular interval has a 95% chance of containing the true value.
How to Assess It
- Exit ticket: In a random poll of 100 students, 60 favor later start times. Use 1.96 as the critical value to calculate a 95% confidence interval for the schoolwide proportion, then interpret it.
Lesson moves
Ways to Teach It
Put 40 red and 60 blue counters in a bag; groups draw 50 with replacement, build proportion intervals, and check which contain 40%.
Post 'There is a 95% chance the true mean lies in this interval'; ask pairs to rewrite the claim using repeated samples.
Give teams cards showing sample mean, sample standard deviation, sample size, and t value; have them match each card to its interval.
Use a random poll of 200 students with 120 pizza votes; calculate a 95% interval and decide whether most students prefer pizza.
Free download
Printable S.DA.5.1 Worksheet
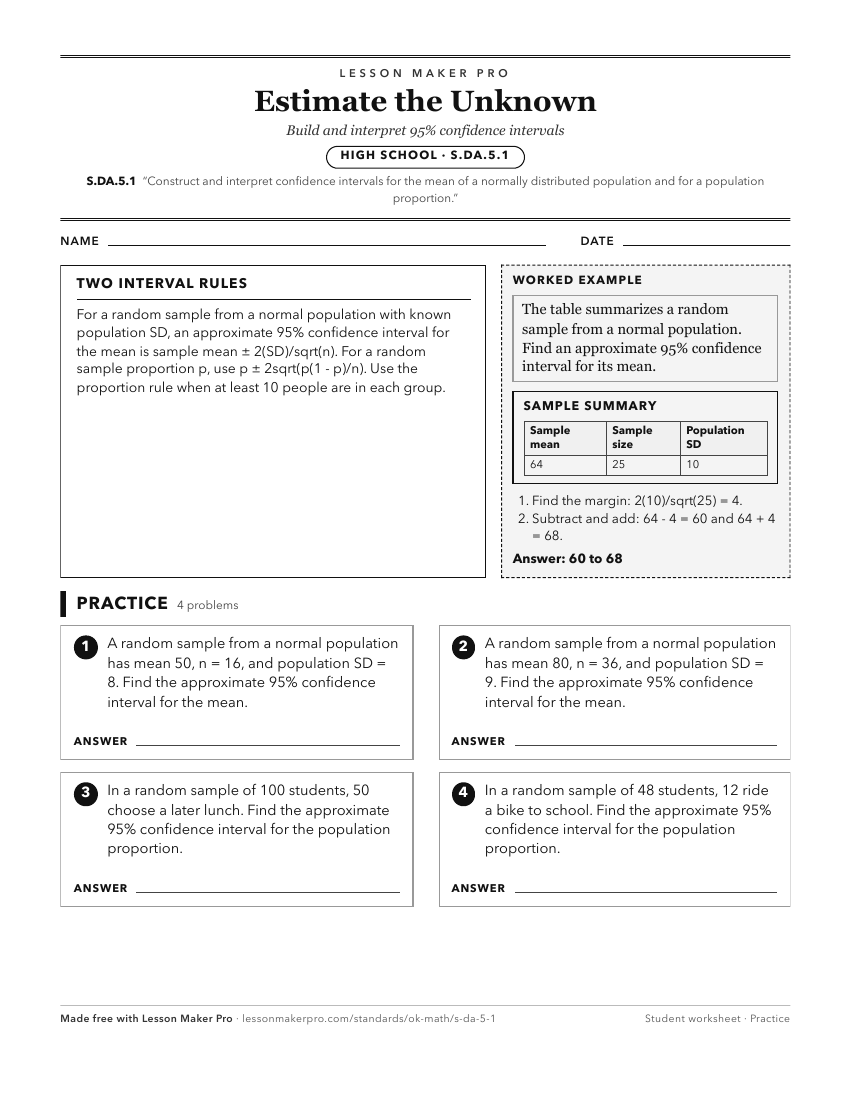
A ready-to-print activity worksheet aligned to S.DA.5.1, with an answer key for the teacher on its own page. No account needed.
PDF, US Letter, prints cleanly in black and white.
Download the worksheetKeep exploring
Related Standards
- S.DA.5.4
Construct a confidence interval for the mean of a normally distributed population (with a known standard deviation) and for a population proportion. Use confide...
- S.DA.5.5
Use confidence intervals to evaluate claims for a single population parameter.
- S.DA.2
Use the mean and standard deviation of a data set to fit it to a normal distribution and to estimate population percentages.
- S.IR.1.2
Understand the concept of a confidence interval, including the interpretation of confidence level, margin of error, and statistical significance.
Turn this exact standard into a lesson
Grade, subject, topic, and the complete standard are prefilled. Create one free, no account needed.
Also for this standard:Make a WorksheetMake a QuizMake a Sub Lesson