Oklahoma Math S.DA.5.4
The Standard
- S.DA.5
- Make statistical inferences and evaluate claims from studies.
Construct a confidence interval for the mean of a normally distributed population (with a known standard deviation) and for a population proportion. Use confidence intervals to evaluate claims.
Oklahoma Academic Standards for Mathematics (2022)
Teacher's field guide
What This Standard Means
What Students Need to Do
- Students calculate a confidence interval for a population mean when the data follow a normal model and the population standard deviation is known. They also calculate an interval for a population proportion. They use each interval to judge whether a claimed value fits the sample data.
What Mastery Looks Like
- Students choose the right formula and calculate the margin of error and endpoints. Before calculating a proportion interval, they check for enough successes and failures. They can explain why a claim outside the interval conflicts with the data, while a claim inside it is not proved.
Common Misconceptions
- Students may use the sample standard deviation instead of the given population standard deviation, or use the mean formula for a proportion. They may think a 95% interval contains 95% of individual values or gives the fixed population value a 95% chance of falling inside it. An interval does not fix a biased sample.
How to Assess It
- Exit ticket: A sample of 25 from a normal population has mean 52 and a known population standard deviation of 10. Find its 95% mean interval, then use 54 yes responses out of 100 to find a 95% proportion interval and check a claim of 60% support.
Lesson moves
Ways to Teach It
Give pairs 20 preprinted measurement cards from a normal model with population standard deviation 4; have them calculate a 95% mean interval.
Ask: If a 95% mean interval runs from 48 to 56, does that mean 95% of individual measurements fall there? Explain.
Flip 100 coins, calculate a 95% interval for the proportion of heads, and score a point if it includes 0.5.
Use a town poll where 75 of 100 people favor a park; calculate an interval and assess a claim of 60% support.
Free download
Printable S.DA.5.4 Worksheet
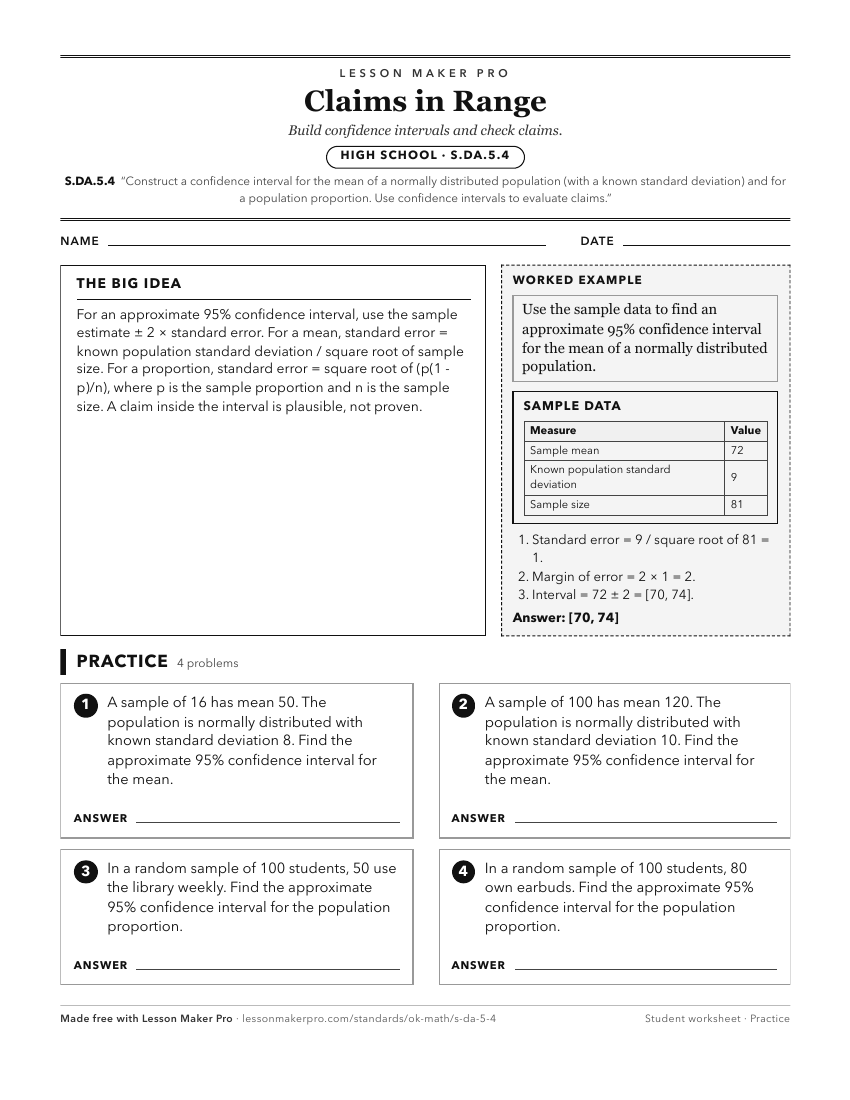
A ready-to-print activity worksheet aligned to S.DA.5.4, with an answer key for the teacher on its own page. No account needed.
PDF, US Letter, prints cleanly in black and white.
Download the worksheetKeep exploring
Related Standards
- S.DA.5.1
Construct and interpret confidence intervals for the mean of a normally distributed population and for a population proportion.
- S.DA.5.5
Use confidence intervals to evaluate claims for a single population parameter.
- S.DA.2
Use the mean and standard deviation of a data set to fit it to a normal distribution and to estimate population percentages.
- A2.D.1.1
Use the mean and standard deviation of a data set to create a normal distribution (bell-shaped curve).
Turn this exact standard into a lesson
Grade, subject, topic, and the complete standard are prefilled. Create one free, no account needed.
Also for this standard:Make a WorksheetMake a QuizMake a Sub Lesson