Oklahoma Math PA.A.2.2
The Standard
- PA.A.2
- Identify and justify linear functions using mathematical models and situations; solve problems involving linear functions and interpret results in the original context.
Identify, describe, and analyze linear relationships between two variables.
Oklahoma Academic Standards for Mathematics (2022)
Teacher's field guide
What This Standard Means
What Students Need to Do
- Students check whether equal changes in one quantity produce equal changes in another. They use a table, graph, or equation to find the rate and starting value, then explain what those numbers mean.
What Mastery Looks Like
- A student can find the rate when the input increases by more than one at a time. They can write an equation, predict a value, and explain the answer with units.
Common Misconceptions
- Students may think any increasing pattern is linear. They may use the change in output as the rate without checking the change in input. Some think a linear graph must pass through zero.
How to Assess It
- Exit ticket: A bike rental costs $5 at 0 hours, $8 at 1 hour, and $11 at 2 hours. Write a cost equation, explain each number, and find the cost at 4 hours.
Lesson moves
Ways to Teach It
Stack 1 to 5 paper cups, measure each stack, and graph cup count against height to check whether each cup adds the same height.
Show the pairs (0, 4), (1, 7), (2, 10) and (0, 4), (1, 7), (2, 11); ask which set fits a straight-line graph and why.
Give students equation, table, and graph cards, including one curved graph; have them match representations and explain why the curved graph does not fit.
Show a phone bill with a $15 base fee and $4 per gigabyte; ask students to write an equation and price 6 gigabytes.
Free download
Printable PA.A.2.2 Worksheet
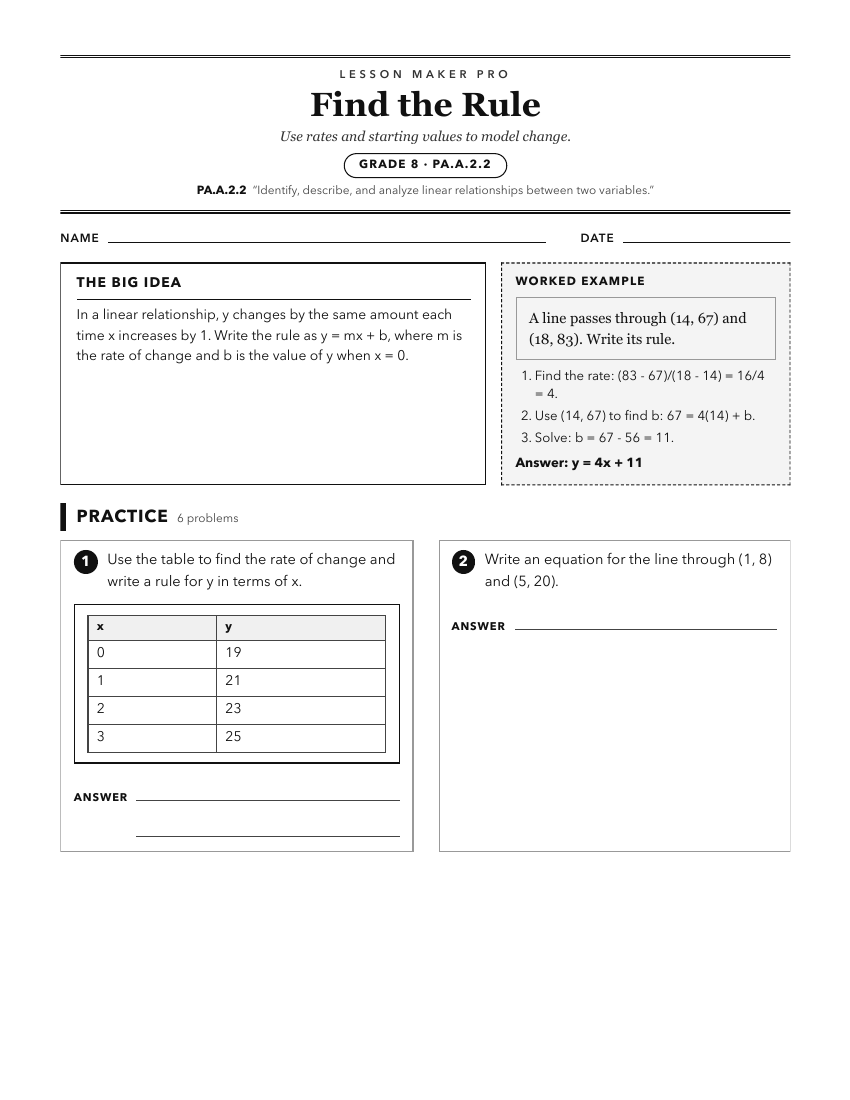
A ready-to-print activity worksheet aligned to PA.A.2.2, with an answer key for the teacher on its own page. No account needed.
PDF, US Letter, prints cleanly in black and white.
Download the worksheetKeep exploring
Related Standards
- A1.D.1
Display, describe, and compare data. For linear relationships, make predictions, and assess the reliability of those predictions.
- A2.D.1.2
Collect data and use scatter plots to analyze patterns and describe linear, exponential, or quadratic relationships between two variables.
- A2.D.1
Display, describe, and compare data. For linear and nonlinear relationships, make predictions and assess the reliability of those predictions.
- A1.A.4
Analyze real-world and mathematical problems involving linear equations.
Turn this exact standard into a lesson
Grade, subject, topic, and the complete standard are prefilled. Create one free, no account needed.
Also for this standard:Make a WorksheetMake a QuizMake a Sub Lesson