Oklahoma Math 5.D.1.2
The Standard
- 5.D.1
- Create and analyze data to find the range and measures of central tendency (mean, median, mode).
Create and analyze line and double-bar graphs with increments of whole numbers, fractions, and decimals.
Oklahoma Academic Standards for Mathematics (2022)
Teacher's field guide
What This Standard Means
What Students Need to Do
- Students build line graphs and double-bar graphs from data. They use evenly spaced whole-number, fraction, or decimal ticks to read values, compare groups, and describe change over time.
What Mastery Looks Like
- Students label the axes and units and include a key when showing two data sets. They use values from the graphs to explain which group is greater or how a value changed.
Common Misconceptions
- Students may skip 0.75 when labeling quarter-unit ticks, making the scale uneven. They may mix up the bar colors or treat points on a line graph as unrelated categories.
How to Assess It
- Give students this table of miles walked: Monday, Ana 0.5 and Bo 0.75; Tuesday, Ana 1 and Bo 1.5; Wednesday, Ana 1.5 and Bo 1.75. Ask them to draw both graph types with 0.25-mile ticks and name the day with the largest gap.
Lesson moves
Ways to Teach It
Cut strips of 0.5, 1, 1.5 inches for A and 0.75, 1.25, 1.75 inches for B; arrange paired bars by day.
Show a line graph rising from 0.5 to 1.25 miles; ask, “How much did the distance change, and which ticks show it?”
Give pairs A/B reading times: Monday, 3/4 and 1 1/4 hours; Tuesday, 1 and 1/2 hours; race to draw double bars.
Plot five bus delays, 0.5, 1, 1.5, 0.5, and 2 minutes, on a line graph with 0.5-minute ticks.
Free download
Printable 5.D.1.2 Worksheet
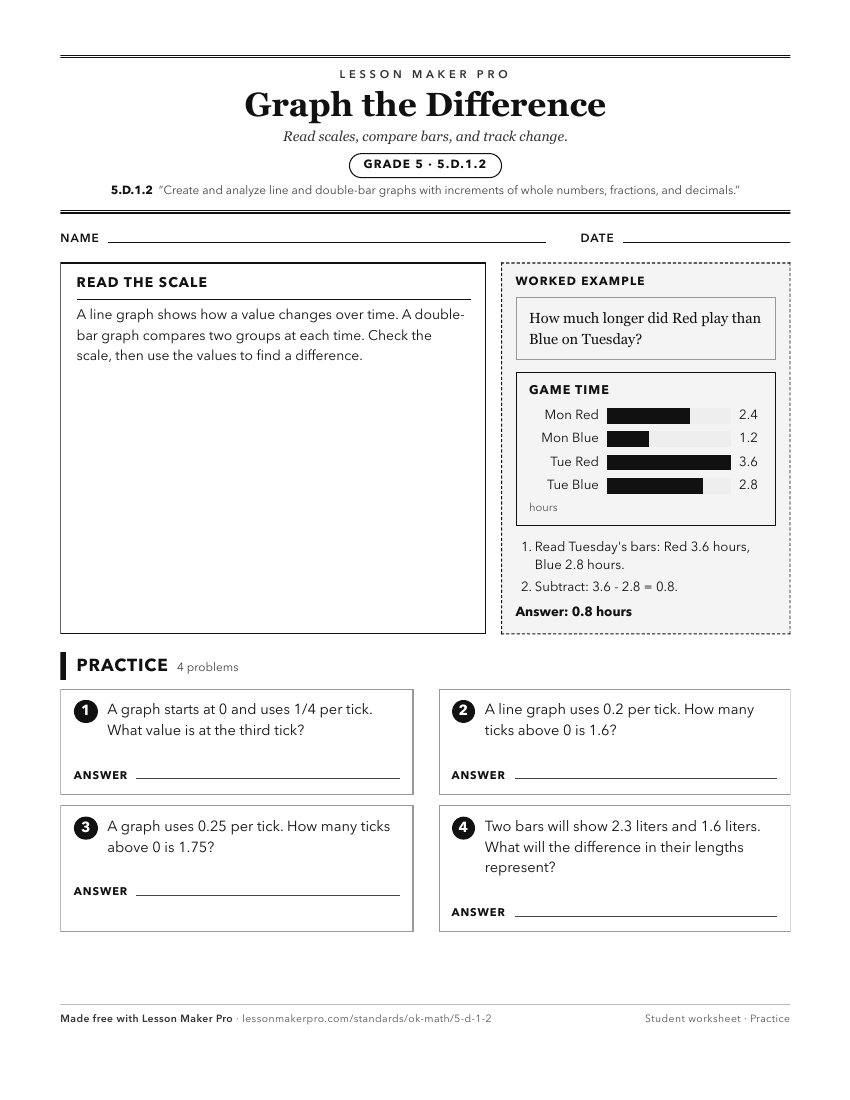
A ready-to-print activity worksheet aligned to 5.D.1.2, with an answer key for the teacher on its own page. No account needed.
PDF, US Letter, prints cleanly in black and white.
Download the worksheetKeep exploring
Related Standards
- 4.D.1.1
Create and organize data on a frequency table or line plot marked with whole numbers and fractions using appropriate titles, labels, and units.
- 4.D.1.3
Solve one- and two-step problems by analyzing data in whole number, decimal, or fraction form in a frequency table and line plot.
- 5.A.1
Describe and graph patterns of change created through numerical patterns.
- 5.N.1.3
Compare and order decimals and fractions, including mixed numbers and fractions less than one, and locate on a number line.
Turn this exact standard into a lesson
Grade, subject, topic, and the complete standard are prefilled. Create one free, no account needed.
Also for this standard:Make a WorksheetMake a QuizMake a Sub Lesson