Oklahoma Math 4.D.1.1
The Standard
- 4.D.1
- Summarize, construct, and analyze data.
Create and organize data on a frequency table or line plot marked with whole numbers and fractions using appropriate titles, labels, and units.
Oklahoma Academic Standards for Mathematics (2022)
Teacher's field guide
What This Standard Means
What Students Need to Do
- Students collect or use measurements and count how often each value occurs. They show the counts in a frequency table or line plot. They add a title, labels, and units.
What Mastery Looks Like
- Given lengths of 1/2, 1, 1, and 1 1/2 inches, a student records counts of 1, 2, and 1. They place the same number of Xs at each value on a line plot and label the lengths in inches.
Common Misconceptions
- Students may put 1/2 after 1 because they focus on the 2, or place 1 1/2 at 1/2. They may put counts where measurements belong or leave inches off the plot.
How to Assess It
- Exit ticket: These strips measure 1/2, 1, 1, 1 1/2, 1/2, and 2 inches. Make a frequency table and a line plot with a title, labels, and units.
Lesson moves
Ways to Teach It
Give pairs six paper strips of different lengths; have them measure to the nearest half inch and plot each length with an X.
Show a line plot titled Ribbon Lengths with no unit; ask, "Could these numbers mean inches or feet? How would you fix it?"
Deal pairs eight cards labeled 1/2, 1, or 1 1/2; have them sort the cards and race to complete a frequency table.
Measure six classroom pencils to the nearest half inch, then make a line plot to find the most common length.
Free download
Printable 4.D.1.1 Worksheet
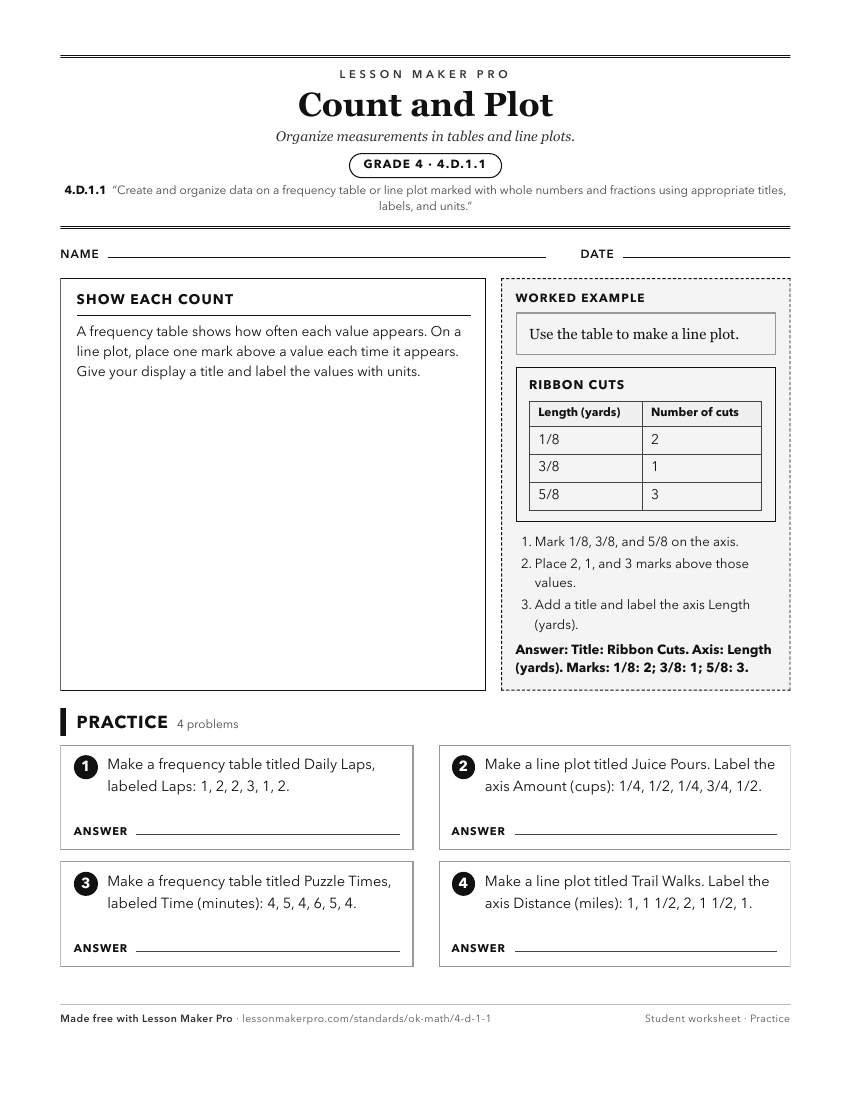
A ready-to-print activity worksheet aligned to 4.D.1.1, with an answer key for the teacher on its own page. No account needed.
PDF, US Letter, prints cleanly in black and white.
Download the worksheetKeep exploring
Related Standards
- 3.D.1.1
Collect and organize a data set with multiple categories using a frequency table, line plot, pictograph, or bar graph with scaled intervals.
- 4.D.1.3
Solve one- and two-step problems by analyzing data in whole number, decimal, or fraction form in a frequency table and line plot.
- 5.D.1.2
Create and analyze line and double-bar graphs with increments of whole numbers, fractions, and decimals.
- 1.D.1.1
Collect, sort, and organize data in up to three categories using representations (e.g., tally marks, tables, Venn diagrams).
Turn this exact standard into a lesson
Grade, subject, topic, and the complete standard are prefilled. Create one free, no account needed.
Also for this standard:Make a WorksheetMake a QuizMake a Sub Lesson