Oklahoma Math 3.D.1.1
The Standard
- 3.D.1
- Collect, organize, and analyze data.
Collect and organize a data set with multiple categories using a frequency table, line plot, pictograph, or bar graph with scaled intervals.
Oklahoma Academic Standards for Mathematics (2022)
Teacher's field guide
What This Standard Means
What Students Need to Do
- Students ask one question with several answer choices and record each response. They count the responses by category and show the totals in a table or graph.
What Mastery Looks Like
- A student counts each response once and puts it in the right category. Their graph has clear labels and an even scale, so a classmate can read each total.
Common Misconceptions
- Students may count one response twice or lose track while tallying. They may treat each picture as one vote when the key says two, or mark uneven steps on a bar graph.
How to Assess It
- Exit ticket: Give students these votes: swing, swing, slide, swing, climb, slide, swing, slide, climb, swing, slide, swing. Ask for a tally table and a bar graph marked 0, 2, 4, 6.
Lesson moves
Ways to Teach It
Have students vote for a favorite recess game on sticky notes, then sort the notes under game labels and tally each pile.
Draw four soccer balls and three basketballs, each worth two votes, then ask, 'Which game got more votes, and by how many?'
Give pairs shuffled vote cards for six tag, four kickball, and two hopscotch votes, then have them make bar graphs counting by twos.
Bring the cafeteria lunch menu, have students survey 10 classmates about their lunch pick, and make a frequency table.
Free download
Printable 3.D.1.1 Worksheet
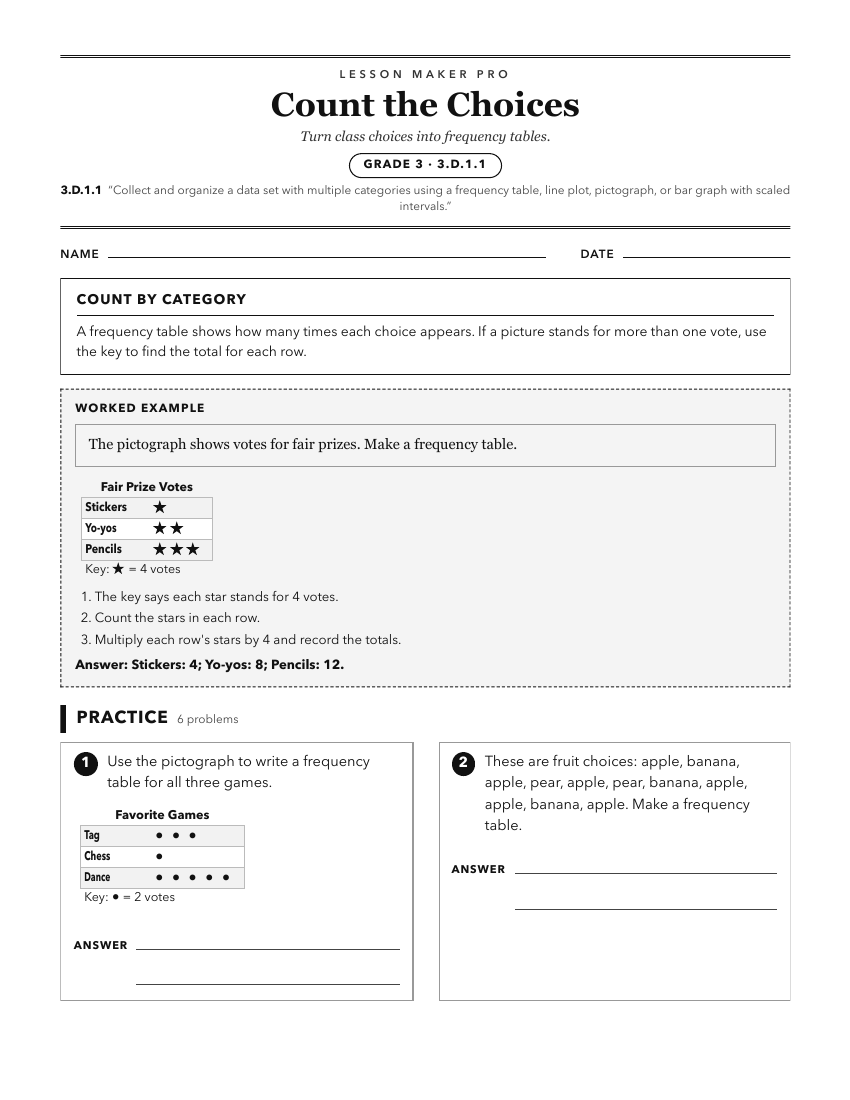
A ready-to-print activity worksheet aligned to 3.D.1.1, with an answer key for the teacher on its own page. No account needed.
PDF, US Letter, prints cleanly in black and white.
Download the worksheetKeep exploring
Related Standards
- 1.D.1.1
Collect, sort, and organize data in up to three categories using representations (e.g., tally marks, tables, Venn diagrams).
- 2.D.1.2
Organize a collection of data with up to four categories using pictographs and bar graphs in intervals of 1s, 2s, 5s or 10s.
- 4.D.1.1
Create and organize data on a frequency table or line plot marked with whole numbers and fractions using appropriate titles, labels, and units.
- 3.D.1.2
Solve one- and two-step problems using categorical data represented with a frequency table, pictograph, or bar graph with scaled intervals.
Turn this exact standard into a lesson
Grade, subject, topic, and the complete standard are prefilled. Create one free, no account needed.
Also for this standard:Make a WorksheetMake a QuizMake a Sub Lesson