Oklahoma Math A1.D.1.2
The Standard
- A1.D.1
- Display, describe, and compare data. For linear relationships, make predictions, and assess the reliability of those predictions.
Collect data and analyze scatter plots for patterns, linearity, and outliers.
Oklahoma Academic Standards for Mathematics (2022)
Teacher's field guide
What This Standard Means
What Students Need to Do
- Collect pairs of measurements and plot each pair as one point. Describe the overall pattern, decide whether it is roughly linear, and spot points that do not fit.
What Mastery Looks Like
- Students label axes, choose a useful scale, and plot pairs accurately. They can identify an outlier and explain why a prediction far beyond the measured data is less reliable.
Common Misconceptions
- Students may connect the dots instead of looking at the whole group of points. They may call any point off a line an outlier or assume a rising pattern proves that one variable causes the other.
How to Assess It
- Exit ticket: Plot (1, 2), (2, 4), (3, 6), (4, 8), and (5, 17). Circle the outlier and say whether the other points form a roughly linear pattern.
Lesson moves
Ways to Teach It
Stack 1 to 6 identical notebooks, measure each stack with a ruler, and plot book count against height.
Plot study hours and quiz scores: (1, 55), (2, 60), (3, 65), (4, 90); discuss which point needs a closer look.
Partners race to plot (1, 3), (2, 5), (3, 7), (4, 9), and (5, 2), then circle the outlier.
A lemonade stand recorded (60°F, 10 cups), (70°F, 15), (80°F, 20), and (90°F, 25); compare predictions for 85°F and 110°F.
Free download
Printable A1.D.1.2 Worksheet
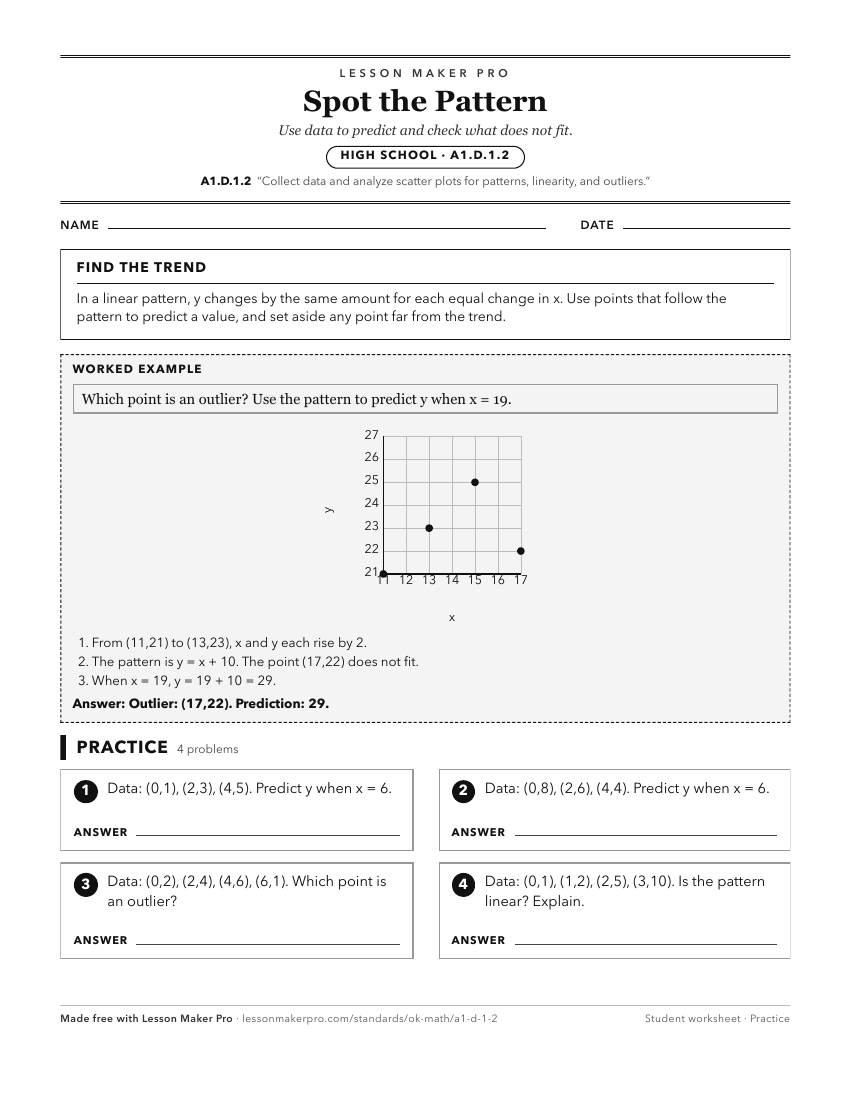
A ready-to-print activity worksheet aligned to A1.D.1.2, with an answer key for the teacher on its own page. No account needed.
PDF, US Letter, prints cleanly in black and white.
Download the worksheetKeep exploring
Related Standards
- S.DA.4.3
Analyze scatter plots for patterns, linearity, outliers, and influential points.
- A2.D.1.2
Collect data and use scatter plots to analyze patterns and describe linear, exponential, or quadratic relationships between two variables.
- PA.D.1.3
Collect, display, and interpret data using scatter plots. Use the shape of the scatter plot to find the informal line of best fit, make statements about the ave...
- PA.D.1
Display and interpret data in a variety of ways, including using scatter plots and approximate lines of best fit. Use the line of best fit and average rate of c...
Turn this exact standard into a lesson
Grade, subject, topic, and the complete standard are prefilled. Create one free, no account needed.
Also for this standard:Make a WorksheetMake a QuizMake a Sub Lesson