Oklahoma Math S.DA.4.3
The Standard
- S.DA.4
- Analyze associations between two variables.
Analyze scatter plots for patterns, linearity, outliers, and influential points.
Oklahoma Academic Standards for Mathematics (2022)
Teacher's field guide
What This Standard Means
What Students Need to Do
- Students describe the direction and shape of a scatter plot. They decide whether a straight line fits the points. They look for unusual points and check whether removing one changes the trend line.
What Mastery Looks Like
- A student can say whether a pattern is roughly linear, curved, or unclear. They can point out an outlier and show whether it changes the trend line when removed.
Common Misconceptions
- Students may call any upward pattern linear, even when the points curve. They may assume every outlier is influential, even if removing it barely changes the trend line.
How to Assess It
- Plot (1,2), (2,3), (3,4), (4,5), (5,6), and (10,2); describe the pattern and draw trend lines with and without (10,2). Is (10,2) an outlier, and is it influential?
Lesson moves
Ways to Teach It
Plot 12 coordinate cards on graph paper, draw a trend line, remove one card, and redraw the line to check its influence.
Show two plots with and without a distant point, and ask, "How did removing that point change the trend line?"
Give pairs three scatter plots to sort as linear, curved, or unclear, then have them circle possible outliers.
Gather eight used-car listings, plot price against mileage, and check whether one high-priced car shifts the trend line.
Free download
Printable S.DA.4.3 Worksheet
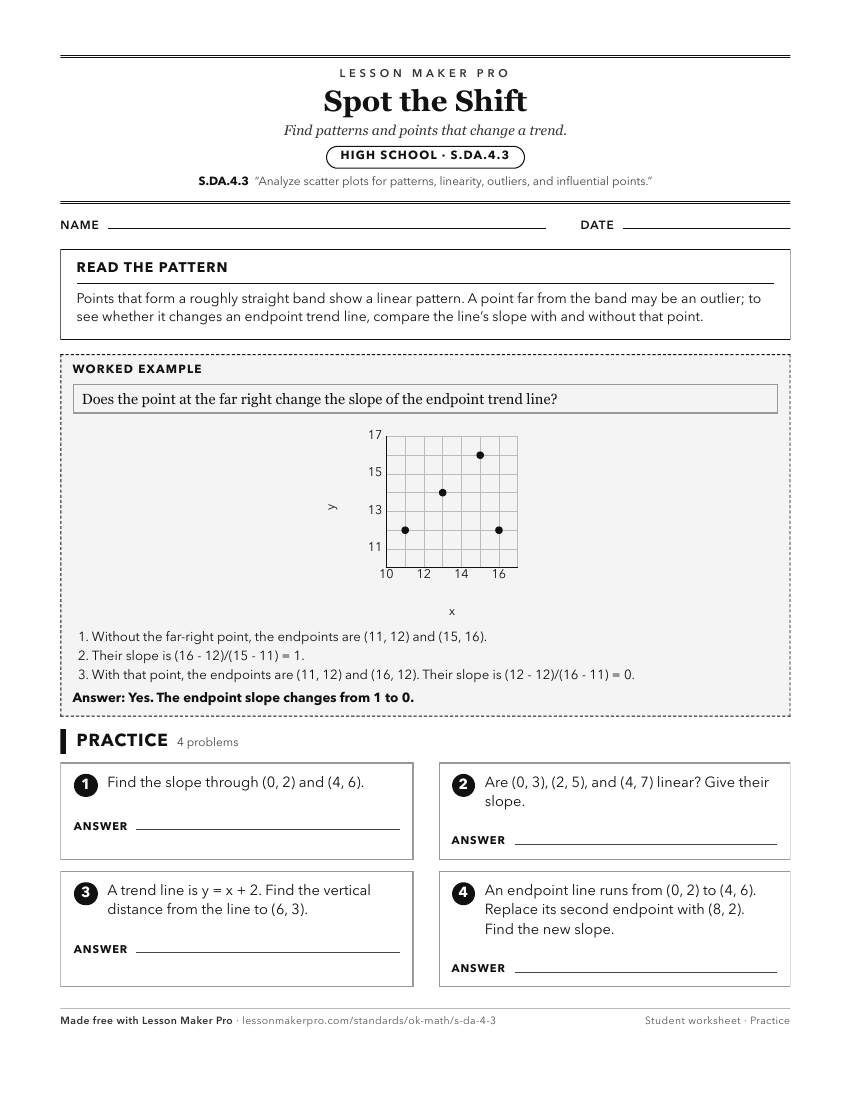
A ready-to-print activity worksheet aligned to S.DA.4.3, with an answer key for the teacher on its own page. No account needed.
PDF, US Letter, prints cleanly in black and white.
Download the worksheetKeep exploring
Related Standards
- A1.D.1.2
Collect data and analyze scatter plots for patterns, linearity, and outliers.
- A2.D.1.2
Collect data and use scatter plots to analyze patterns and describe linear, exponential, or quadratic relationships between two variables.
- PA.D.1.3
Collect, display, and interpret data using scatter plots. Use the shape of the scatter plot to find the informal line of best fit, make statements about the ave...
- PA.D.1
Display and interpret data in a variety of ways, including using scatter plots and approximate lines of best fit. Use the line of best fit and average rate of c...
Turn this exact standard into a lesson
Grade, subject, topic, and the complete standard are prefilled. Create one free, no account needed.
Also for this standard:Make a WorksheetMake a QuizMake a Sub Lesson