Oklahoma Math A2.F.1.9
The Standard
- A2.F.1
- Understand functions as descriptions of covariation (how related quantities vary together).
Recognize whether a discrete or continuous graphical representation is appropriate to create a graph based upon a mathematical model.
Oklahoma Academic Standards for Mathematics (2022)
Teacher's field guide
What This Standard Means
What Students Need to Do
- Students decide which input values make sense in a situation before drawing its graph. They plot separate points for counts and connect the graph when values between measurements are possible.
What Mastery Looks Like
- Given $4 per whole notebook and travel at 4 miles per hour, students draw separate cost points and a connected distance graph. They explain why 1.5 notebooks is not allowed but 1.5 hours is.
Common Misconceptions
- Students may connect every set of plotted points because a line looks more complete. Others plot only the measurements they recorded, even when values between those measurements are possible. Some assume every graph involving time must be connected, even when the input counts completed days.
How to Assess It
- Exit ticket: Graph C = 6n for n whole $6 notebooks and d = 6t for hours traveled at 6 mph, using inputs from 0 to 4. Show whether to connect each graph and explain what an input of 1.5 means in each.
Lesson moves
Ways to Teach It
Plot the cost of whole $2 sticker sheets, then time water filling a marked cup and sketch its volume between readings.
Ask: Why is 1.5 whole tickets not allowed on a cost graph, while 1.5 hours belongs on a driving distance graph?
Sort cards labeled ticket cost, ribbon cost per meter, and water volume over time into separate points or connected graphs.
Compare a $3 bus fare per passenger with gas sold at $3 per liter, and sketch each total cost graph.
Free download
Printable A2.F.1.9 Worksheet
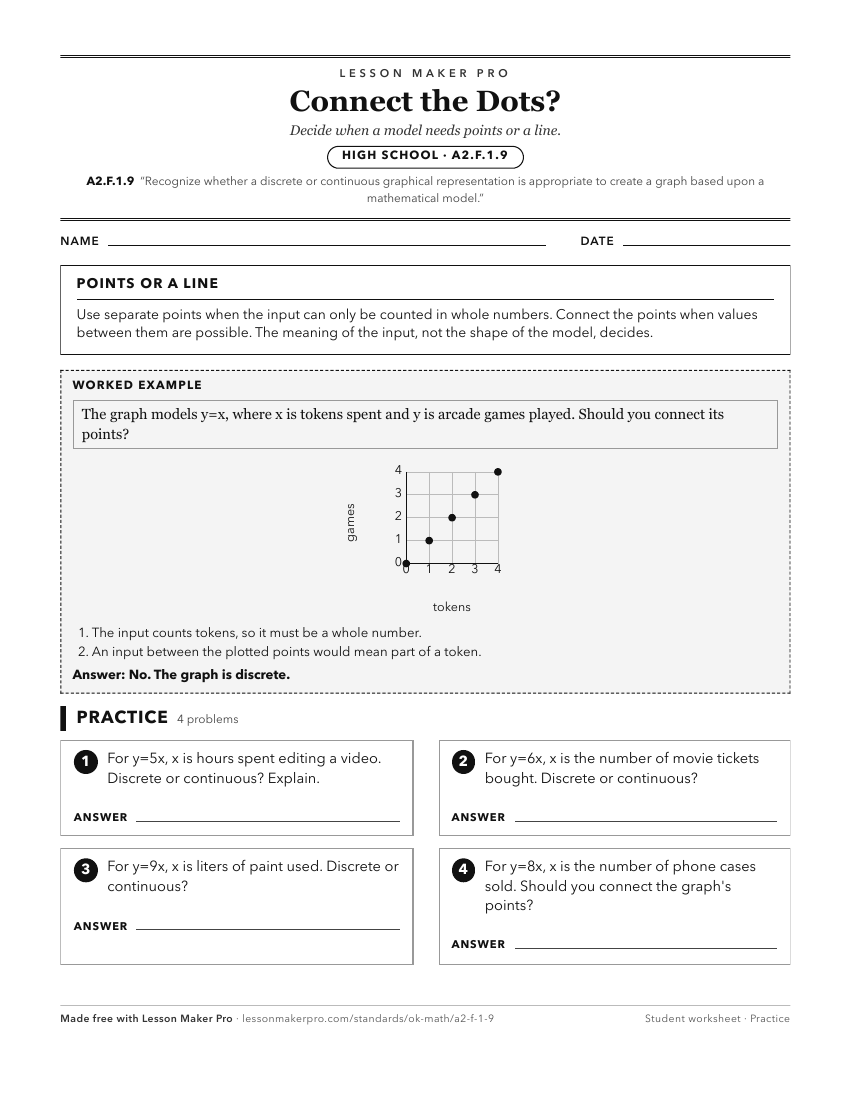
A ready-to-print activity worksheet aligned to A2.F.1.9, with an answer key for the teacher on its own page. No account needed.
PDF, US Letter, prints cleanly in black and white.
Download the worksheetKeep exploring
Related Standards
- A1.F.1.5
Interpret graphs as being discrete or continuous.
- PC.F.1.3
Interpret characteristics of graphs and tables for a function that models a relationship between two quantities in terms of the quantities.
- PC.F.1.2
Sketch the graph of a function that models a relationship between two quantities, identifying key features.
- A2.A.1.7
Represent and evaluate mathematical models using systems of linear equations with a maximum of three variables. Graphing calculators or other appropriate techno...
Turn this exact standard into a lesson
Grade, subject, topic, and the complete standard are prefilled. Create one free, no account needed.
Also for this standard:Make a WorksheetMake a QuizMake a Sub Lesson