Oklahoma Math PA.A.2.1
The Standard
- PA.A.2
- Identify and justify linear functions using mathematical models and situations; solve problems involving linear functions and interpret results in the original context.
Represent linear functions with tables, verbal descriptions, symbols, and graphs; translate from one representation to another.
Oklahoma Academic Standards for Mathematics (2022)
Teacher's field guide
What This Standard Means
What Students Need to Do
- Students show the same relationship as a story, table, equation, and graph. They move between these forms and explain the starting value and rate of change.
What Mastery Looks Like
- Given the points (0, 3), (1, 5), and (2, 7), a student writes y = 2x + 3 and graphs the line. They explain what 3 and 2 mean in a story about cost.
Common Misconceptions
- Students may confuse the starting value with the rate, or assume every linear graph passes through (0, 0). They may compare changes in y without checking how much x changes.
How to Assess It
- Exit ticket: A bike rental costs $4 to start and $3 per hour. Write a rule, make a table for 0, 1, and 2 hours, sketch the graph, and label the starting cost and hourly rate.
Lesson moves
Ways to Teach It
Use $2 counters and a $3 starting-fee card to build trip costs for 0 to 4 miles, then graph the totals.
Display (0, 3), (1, 5), and (2, 7); ask, 'Where do you see the starting fee and per-mile cost?'
Hand out mixed tables, graphs, rules, and stories for three plans; groups match each set and defend one match.
Show a gym flyer with a $20 signup fee and $10 monthly charge; students write and graph the total for six months.
Free download
Printable PA.A.2.1 Worksheet
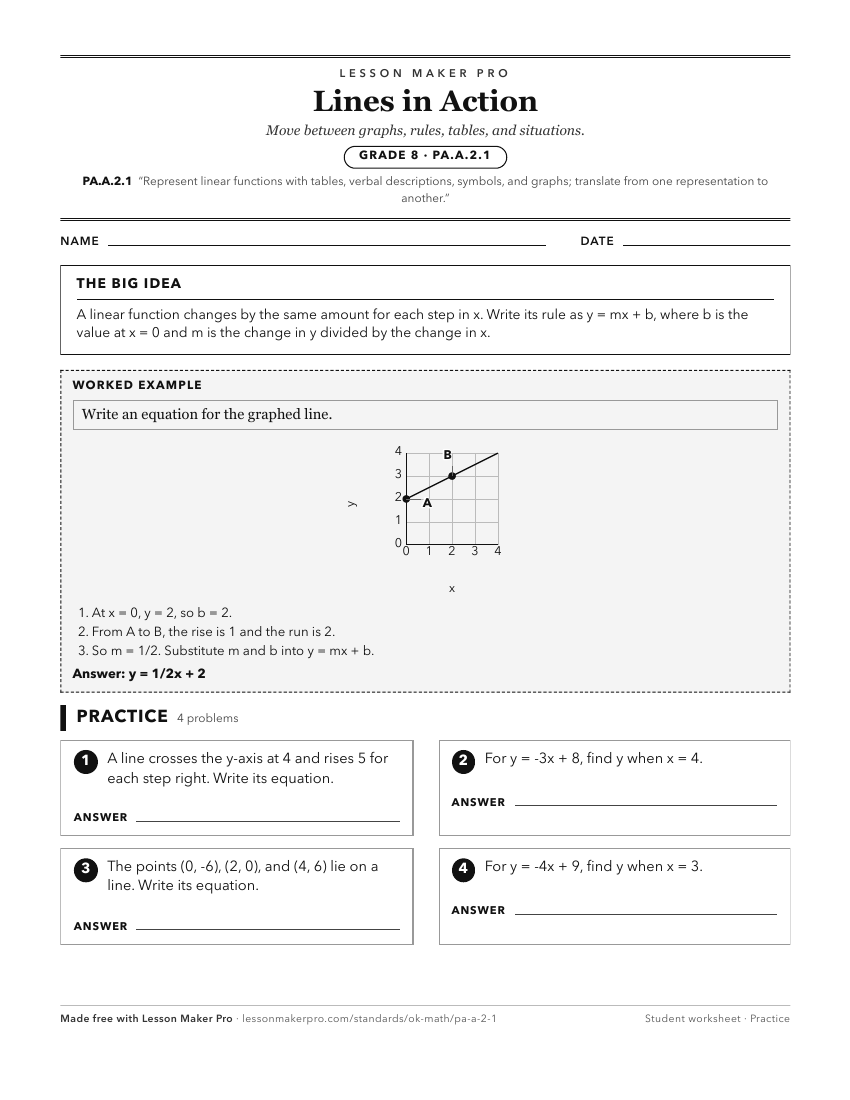
A ready-to-print activity worksheet aligned to PA.A.2.1, with an answer key for the teacher on its own page. No account needed.
PDF, US Letter, prints cleanly in black and white.
Download the worksheetKeep exploring
Related Standards
- A1.F.3.1
Identify and generate equivalent representations of linear functions, graphs, tables, and real-world situations.
- 7.A.2.1
Represent proportional relationships with tables, verbal descriptions, symbols, and graphs; translate from one representation to another. Determine and compare ...
- PA.A.1.2
Use linear functions to represent and model mathematical situations.
- 6.A.1.2
Represent relationships between two varying positive quantities involving no more than two operations with rules, graphs, and tables; translate between any two ...
Turn this exact standard into a lesson
Grade, subject, topic, and the complete standard are prefilled. Create one free, no account needed.
Also for this standard:Make a WorksheetMake a QuizMake a Sub Lesson