Oklahoma Math A1.F.2
Standard Cluster
Recognize and understand that families of functions are defined by their characteristics. Distinguish between linear and nonlinear (including exponential) functions. Understand that linear functions grow by equal intervals (arithmetic) and that exponential functions grow by equal factors over equal intervals (geometric). Recognize the parent functions f(x) = x and f(x) = |x|. Predict the effects of vertical and horizontal transformations f(x + c) and f(x) + c, algebraically and graphically.
Oklahoma Academic Standards for Mathematics (2022)
Cluster contents
Standards in This Cluster
A1.F.2 is a cluster heading. These are the individual standards under it.
- A1.F.2.1
Distinguish between linear and nonlinear (including exponential) functions. Understand that linear functions grow by equal intervals (arithmetic) and that expon...
- A1.F.2.2
Recognize the parent functions f(x) = x and f(x) = |x|. Predict the effects of vertical and horizontal transformations f(x + c) and f(x) + c, algebraically and ...
Teacher's field guide
What This Cluster Means
What Students Need to Do
- Students sort tables and graphs into linear, exponential, and other nonlinear families. They use equal differences or equal factors to describe growth, then predict how f(x + c) and f(x) + c move the graphs of y = x and y = |x|.
What Mastery Looks Like
- For equal steps in x, students use constant differences to spot linear growth and constant factors to spot exponential growth. They recognize y = x as a line and y = |x| as a V. They sketch y = |x + 2| + 1 with its vertex at (-2, 1).
Common Misconceptions
- Students may call 2, 4, 8 linear just because the outputs rise. They may call the V-shaped absolute value graph exponential. They often move f(x + 2) right instead of left, or confuse it with f(x) + 2.
How to Assess It
- Exit ticket: For x = 0, 1, 2, classify the outputs 2, 4, 6 and 2, 4, 8, and give the difference or factor. Sketch y = |x + 2| + 1 and label its vertex.
Lesson moves
Ways to Teach It
Draw y = x and y = |x| on separate clear sheets, place them over graph paper, and slide each left two squares and up one.
Have pairs explain why 3, 6, 12 is exponential but 3, 6, 9 is linear when x increases by one.
Deal cards showing tables, equations, and graphs; have pairs sort them into linear, exponential, and other nonlinear, then defend one tricky card.
Start two $100 balances, add $20 yearly to one and 10% yearly to the other, then graph both for five years.
Free download
Printable A1.F.2 Worksheet
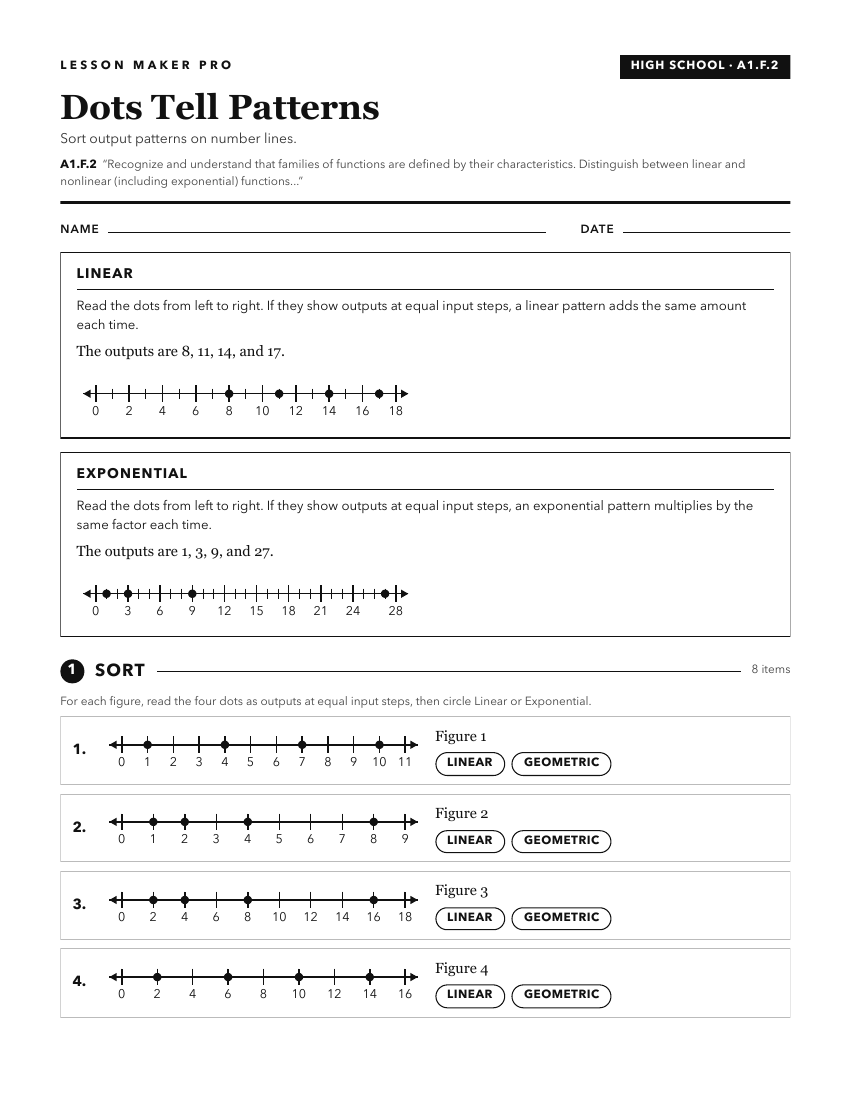
A ready-to-print activity worksheet aligned to A1.F.2, with an answer key for the teacher on its own page. No account needed.
PDF, US Letter, prints cleanly in black and white.
Download the worksheetKeep exploring
Related Standards
- PC.F.1.1
Interpret characteristics of a function defined by an expression in the context of the situation.
- A1.F.1.1
Distinguish between relations and functions.
- A2.F.1
Understand functions as descriptions of covariation (how related quantities vary together).
- PA.A.1.1
Recognize that a function is a relationship between an independent variable and a dependent variable in which the value of the independent variable determines t...
Turn this cluster into a lesson
Grade, subject, topic, and the complete cluster are prefilled. Create one free, no account needed.
Also for this cluster:Make a WorksheetMake a QuizMake a Sub Lesson