NGSS MS-LS4-6
The Standard
Use mathematical representations to support explanations of how natural selection may lead to increases and decreases of specific traits in populations over time.
Next Generation Science Standards
Teacher's field guide
What This Standard Means
What Students Need to Do
- Students calculate and compare the proportion of a trait in a population across several generations. They use tables, graphs, ratios, or probability to explain changes caused by natural selection.
What Mastery Looks Like
- Given trait counts over several generations, students convert counts to percentages and graph the results accurately. They connect the trend to differences in survival and reproduction without claiming individual organisms changed traits.
Common Misconceptions
- Students may compare raw counts when population totals differ, rather than proportions. They may think organisms develop needed traits, selection changes individuals, or dominant traits always become more common.
How to Assess It
- Give this exit ticket: Generation 1 has 20 dark and 80 light beetles; generation 5 has 45 dark and 55 light beetles. Students calculate percentages and explain the change if birds more often spot light beetles.
Lesson moves
Ways to Teach It
Spread 40 black and white paper moths on patterned fabric, run three predation rounds, and graph each color's proportion after every round.
Students answer, “Did individual moths change color, or did the population change, and what graph evidence supports your claim?”
Use trait-frequency cards from five generations; teams calculate percentages, order the cards, and identify the strongest increase or decrease.
Compare antibiotic-resistant bacteria percentages before and after treatment, then explain why resistance becomes more common among survivors and their descendants.
Free download
Printable MS-LS4-6 Worksheet
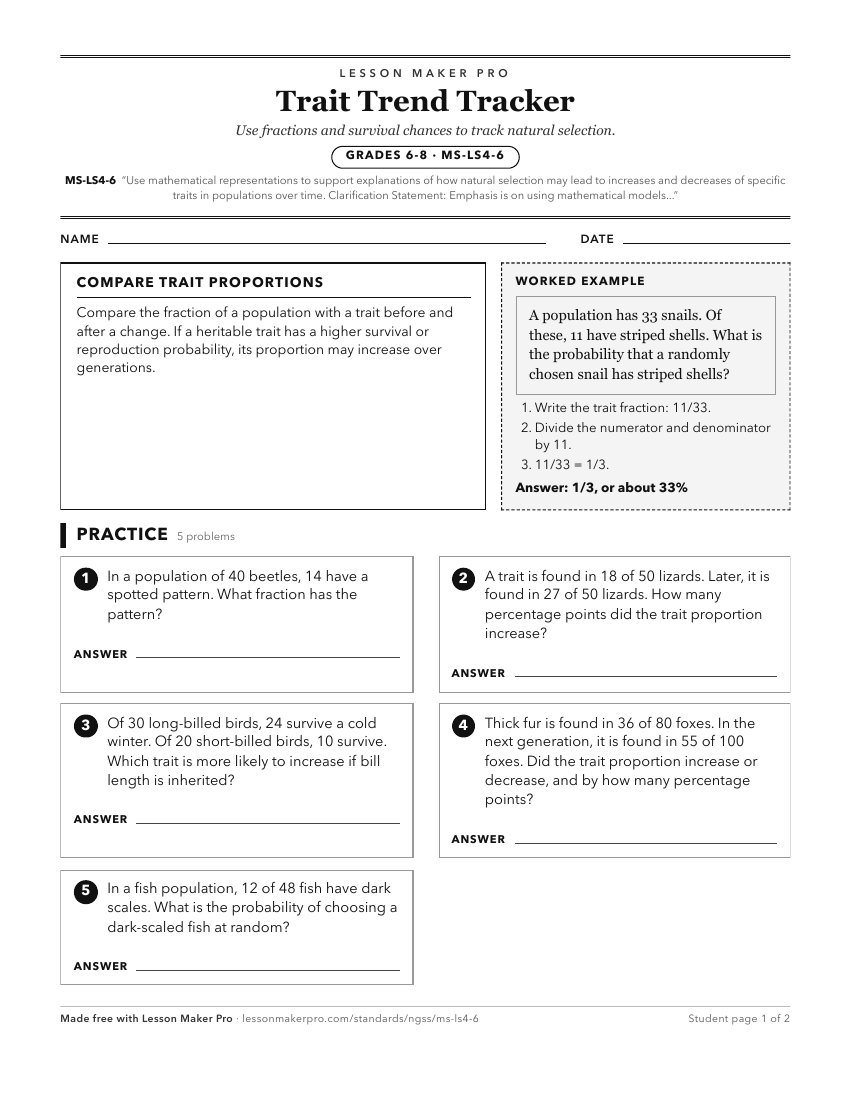
A ready-to-print activity worksheet aligned to MS-LS4-6, with an answer key for the teacher on its own page. No account needed.
PDF, US Letter, prints cleanly in black and white.
Download the worksheetBefore This Standard
If students are struggling here, check these first.
What This Unlocks
Mastery here sets students up for these next.
- HS-LS4-5
Middle school trait-frequency reasoning supports high school evaluation of evidence for population growth, speciation, and extinction under environmental change.
- HS-LS4-4
Tracking trait frequency changes over time supports explaining how natural selection produces population adaptations from evidence.
- HS-LS4-3
Middle school trait-frequency modeling carries into high school statistical explanations of how advantageous heritable traits change population proportions.
- HS-LS4-2
Tracking how traits change in populations supports explaining how variation, competition, and differential reproduction drive evolution.
Keep exploring
Related Standards
- HS-LS2-2
Use mathematical representations to support and revise explanations based on evidence about factors affecting biodiversity and populations in ecosystems of diff...
- MS-LS4-4
Construct an explanation based on evidence that describes how genetic variations of traits in a population increase some individuals' probability of surviving a...
Turn this exact standard into a lesson
Grade, subject, topic, and the complete standard are prefilled. Create one free, no account needed.
Also for this standard:Make a WorksheetMake a QuizMake a Sub Lesson