NGSS HS-LS2-2
The Standard
Use mathematical representations to support and revise explanations based on evidence about factors affecting biodiversity and populations in ecosystems of different scales.
Next Generation Science Standards
Teacher's field guide
What This Standard Means
What Students Need to Do
- Students calculate averages, identify trends, and compare graphs from provided ecosystem data. They use the patterns to explain how factors such as habitat size, rainfall, or invasive species affect populations and biodiversity.
What Mastery Looks Like
- Given two or more data sets, students calculate accurately and create or interpret clearly labeled graphs. They cite numerical patterns to support an explanation and revise it when added evidence shows a different pattern.
Common Misconceptions
- Students often confuse biodiversity with the total number of organisms. They may treat one unusual value as a trend, compare raw totals when sample sizes differ, or claim that correlation proves cause.
How to Assess It
- Exit ticket: A pond had species counts of 8, 10, and 9 before runoff, then 5, 4, and 6 after runoff. Calculate both means, describe the trend, and revise the claim, “Runoff had no effect.”
Lesson moves
Ways to Teach It
Scatter colored beads across two habitat trays, sample each with paper quadrats, then compare average abundance and species richness.
Show two population graphs and ask students to write which factor best explains the difference, using two numerical details.
Play a graph-match game where teams pair ecosystem data tables with graphs, trend statements, and evidence-based explanations.
Use local park species data from before and after habitat restoration to calculate averages and judge whether biodiversity changed.
Free download
Printable HS-LS2-2 Worksheet
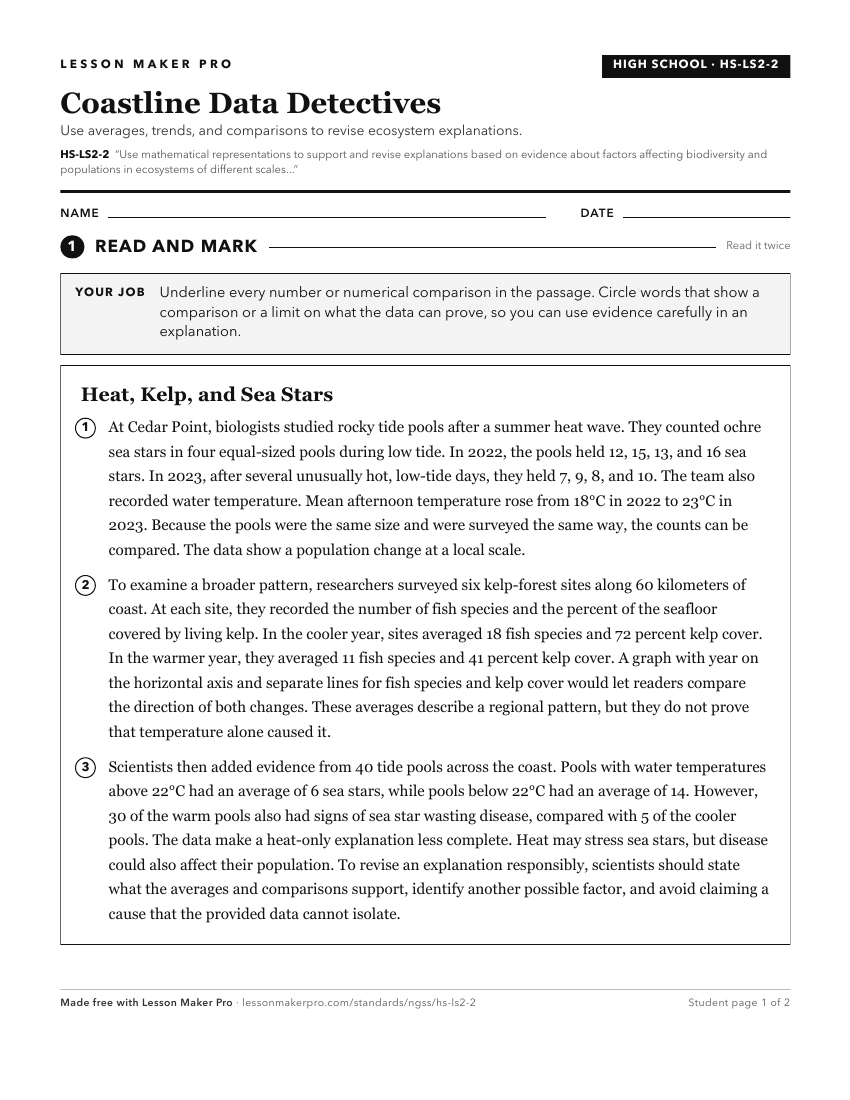
A ready-to-print activity worksheet aligned to HS-LS2-2, with an answer key for the teacher on its own page. No account needed.
PDF, US Letter, prints cleanly in black and white.
Download the worksheetBefore This Standard
If students are struggling here, check these first.
- MS-LS2-2
Predicting organism interactions across ecosystems prepares students to explain population and biodiversity changes across scales using evidence and mathematics.
- MS-LS2-4
Students move from evidence-based arguments about ecosystem changes affecting populations to modeling factors affecting populations and biodiversity across scales.
- MS-LS2-1
Interpreting data on resource effects prepares students to model how limiting factors change populations and biodiversity across ecosystems.
- MS-LS2-5
Understanding biodiversity and ecosystem services supports explaining how ecosystem factors change biodiversity and populations across scales.
Keep exploring
Related Standards
- HS-LS2-1
Use mathematical and/or computational representations to support explanations of factors that affect carrying capacity of ecosystems at different scales.
- MS-LS4-6
Use mathematical representations to support explanations of how natural selection may lead to increases and decreases of specific traits in populations over tim...
Turn this exact standard into a lesson
Grade, subject, topic, and the complete standard are prefilled. Create one free, no account needed.
Also for this standard:Make a WorksheetMake a QuizMake a Sub Lesson