NGSS HS-LS2-1
The Standard
Use mathematical and/or computational representations to support explanations of factors that affect carrying capacity of ecosystems at different scales.
Next Generation Science Standards
Teacher's field guide
What This Standard Means
What Students Need to Do
- Students analyze population data in graphs, tables, charts, or simulations. They use numerical patterns to explain how resources, climate, competition, and habitat boundaries change sustainable population size at local and larger scales.
What Mastery Looks Like
- Students can create or read a graph, table, or simulation showing population change over time. They identify leveling, overshoot, or decline and use numbers to compare how conditions affect sustainable population size.
Common Misconceptions
- Students may treat carrying capacity as a fixed number that never changes. They may assume populations stop exactly at that number or that every population decline means capacity decreased.
How to Assess It
- Give students a table showing a deer population leveling near 600, then stabilizing near 380 after forage drops 40 percent. Ask them to explain the change using two data values.
Lesson moves
Ways to Teach It
Use beans as food tokens in habitat trays with different sizes, then graph how many paper animals survive across eight rounds.
Compare population graphs from wet and dry years, then write a claim explaining which factor changed carrying capacity using numerical evidence.
Draw climate, resource, and competition cards, update a shared spreadsheet population, and justify each change in carrying capacity.
Compare local deer counts with rainfall or habitat data from a state wildlife agency, then identify patterns and possible limits.
Free download
Printable HS-LS2-1 Worksheet
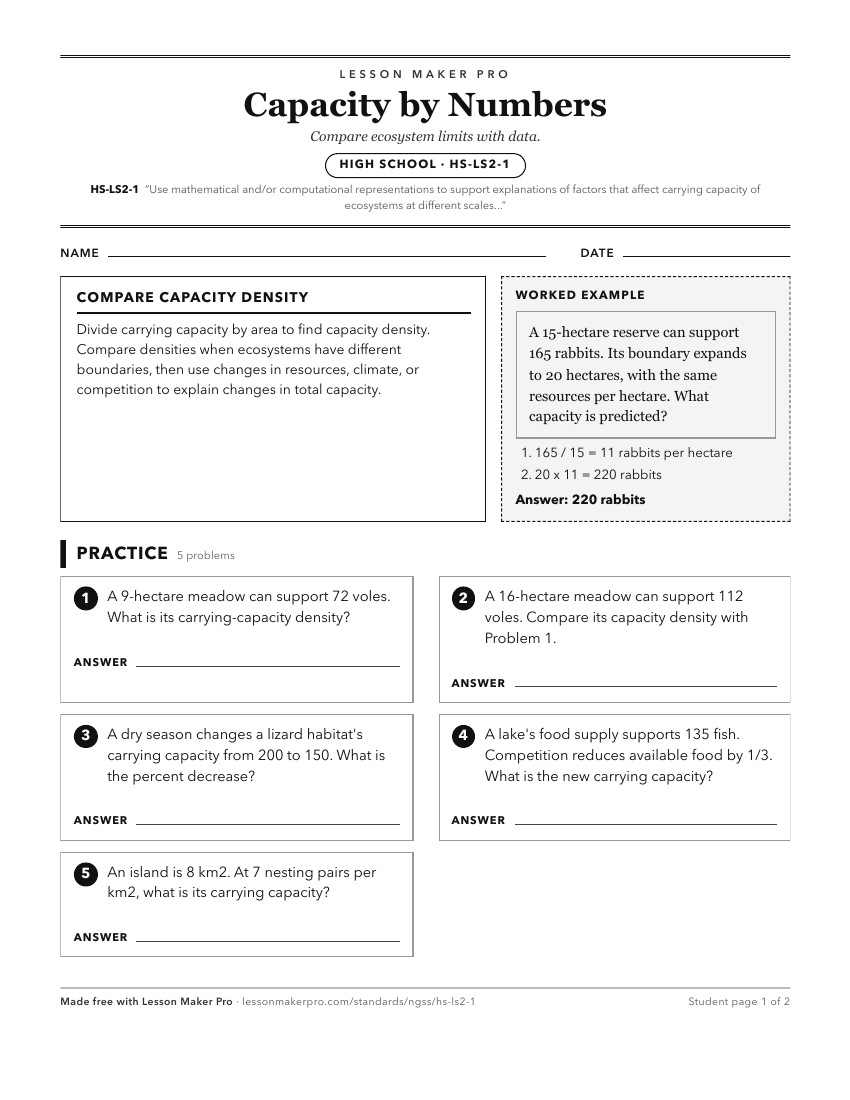
A ready-to-print activity worksheet aligned to HS-LS2-1, with an answer key for the teacher on its own page. No account needed.
PDF, US Letter, prints cleanly in black and white.
Download the worksheetBefore This Standard
If students are struggling here, check these first.
- MS-LS2-2
Predicting organism interaction patterns supports explaining how resource limits, competition, and other factors affect carrying capacity across ecosystem scales.
- MS-LS2-1
Students extend resource availability effects on populations into mathematical models explaining carrying capacity across ecosystem scales.
Keep exploring
Related Standards
- HS-LS2-4
Use a mathematical representation to support claims for the cycling of matter and flow of energy among organisms in an ecosystem.
- HS-LS2-2
Use mathematical representations to support and revise explanations based on evidence about factors affecting biodiversity and populations in ecosystems of diff...
- MS-LS4-6
Use mathematical representations to support explanations of how natural selection may lead to increases and decreases of specific traits in populations over tim...
Turn this exact standard into a lesson
Grade, subject, topic, and the complete standard are prefilled. Create one free, no account needed.
Also for this standard:Make a WorksheetMake a QuizMake a Sub Lesson