CCSS.
The Standard
Understand that the probability of a chance event is a number between 0 and 1 that expresses the likelihood of the event occurring. Larger numbers indicate greater likelihood. A probability near 0 indicates an unlikely event, a probability around 1/2 indicates an event that is neither unlikely nor likely, and a probability near 1 indicates a likely event.
Common Core State Standards for Mathematics · Statistics and Probability
Teacher's field guide
What This Standard Means
What Students Need to Do
- Students interpret probability values as measures of how likely outcomes are. They compare values and describe events as impossible, unlikely, evenly likely, likely, or certain.
What Mastery Looks Like
- Students can order probabilities written as fractions, decimals, or percentages. They can match each value to a reasonable event and explain their choice using likelihood language.
Common Misconceptions
- Students may give probabilities below 0 or above 1. They may think a probability of 0.5 guarantees exactly half the outcomes in a small number of trials. Some reverse the scale and treat values near 0 as more likely.
How to Assess It
- Exit ticket: Order 0.05, 0.45, 0.75, and 1 from least to most likely, then label each with a reasonable likelihood description.
Lesson moves
Ways to Teach It
Give pairs a bag with 1 red and 9 blue cubes, then have them predict and test the chance of drawing red.
Ask students to explain in writing why an event with probability 0.8 is more likely than one with probability 0.3.
Play a card sort where students match probability values, likelihood words, and event descriptions, then place each set on a number line.
Show four weather forecasts with different rain percentages and ask students to choose which day most needs an umbrella.
Free download
Printable 7.SP.C.5 Worksheet
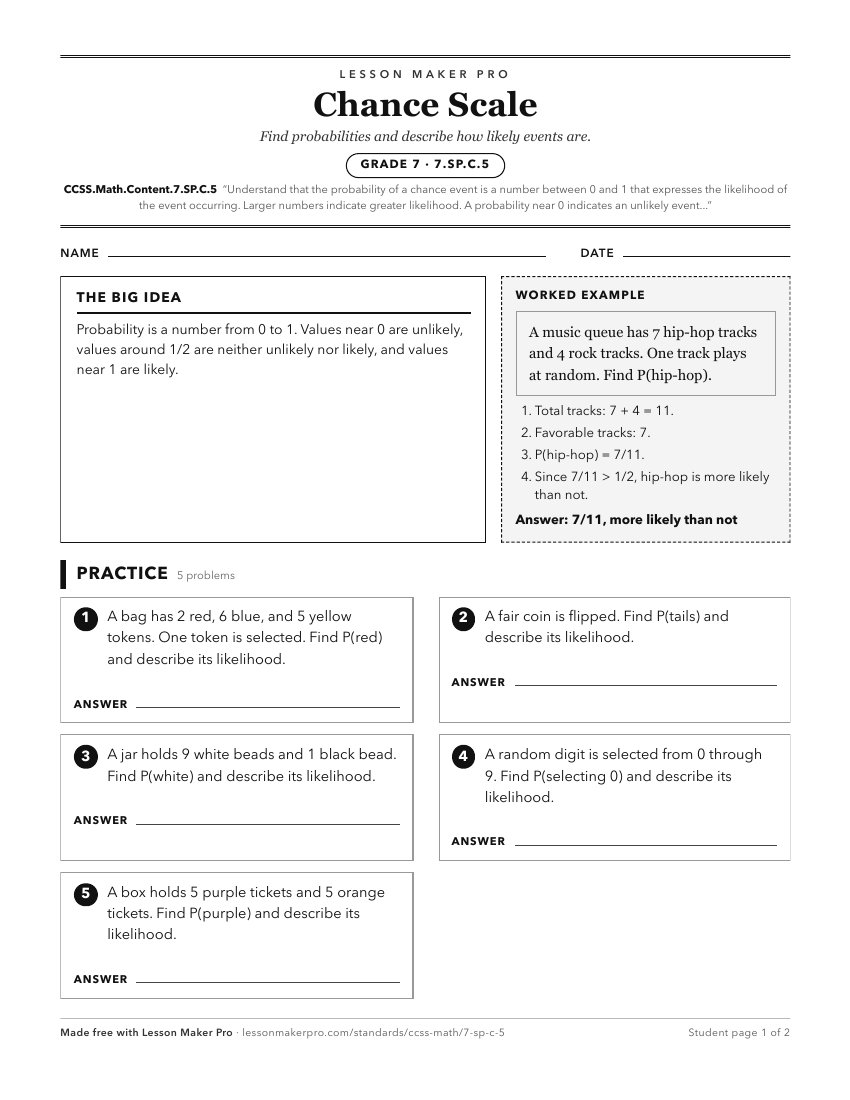
A ready-to-print activity worksheet aligned to CCSS.Math.Content.7.SP.C.5, with an answer key for the teacher on its own page. No account needed.
PDF, US Letter, prints cleanly in black and white.
Download the worksheetLearning progression
Where This Standard Sits
See the whole path on the Statistics & Probability progression map.
Before This Standard
If students are struggling here, check these first.
- CCSS.Math.Content.6.NS.C.7
Ordering rational numbers supports comparing probabilities between 0 and 1 and using benchmarks like 0, 1/2, and 1.
- CCSS.Math.Content.6.NS.C.6
Interpreting probabilities as values from 0 to 1 uses rational number magnitude and placement on a number line.
- CCSS.Math.Content.5.NBT.A.3
Comparing decimals between 0 and 1 helps students order probability values and connect larger numbers with greater likelihood.
What This Unlocks
Mastery here sets students up for these next.
- CCSS.Math.Content.7.SP.C.8a
Interpreting probabilities from 0 to 1 helps students see compound-event fractions as measures of likelihood, not just counts.
- CCSS.Math.Content.7.SP.C.6
Interpreting relative frequency as a probability requires knowing probability as a 0 to 1 measure of likelihood.
- CCSS.Math.Content.7.SP.C.7a
Understanding probability as a 0 to 1 likelihood scale supports assigning equal outcome probabilities and interpreting event probabilities.
- CCSS.Math.Content.7.SP.C.7
Interpreting probabilities from 0 to 1 is needed to create models, judge likelihoods, and compare predictions with observed frequencies.
- CCSS.Math.Content.7.SP.C.8
Students must understand probability values from 0 to 1 before calculating and interpreting probabilities for compound events.
- CCSS.Math.Content.7.SP.C.8c
Students use the 0 to 1 likelihood scale to interpret simulated frequencies as probabilities for compound events.
Turn this exact standard into a lesson
Grade, subject, topic, and the complete standard are prefilled. Create one free, no account needed.
Also for this standard:Make a WorksheetMake a QuizMake a Sub Lesson