CCSS.
The Standard
Identify the constant of proportionality (unit rate) in tables, graphs, equations, diagrams, and verbal descriptions of proportional relationships.
Common Core State Standards for Mathematics
Teacher's field guide
What This Standard Means
What Students Need to Do
- Students find the multiplicative factor connecting two quantities in a proportional relationship. They read it from tables, graphs, equations, diagrams, and written situations, then state what it means.
What Mastery Looks Like
- Students find the same unit rate from any nonzero pair in a table or graph. They identify it as the coefficient in an equation and explain its meaning with correct units.
Common Misconceptions
- Students may divide in the wrong order and report x divided by y instead of y divided by x. They may look for a constant difference rather than a constant ratio. On graphs, they may use one coordinate alone instead of comparing vertical change to horizontal change from the origin.
How to Assess It
- Give this exit ticket: A table shows x-values 3, 5, 8 and y-values 12, 20, 32. Find the unit rate and write the equation.
Lesson moves
Ways to Teach It
Have students build tile rectangles for several x-values, record matching y-values, and calculate y divided by x for each pair.
Ask students to explain why a graph through points (2, 6) and (5, 15) has a unit rate of 3.
Run a card sort matching tables, graphs, equations, and word problems that share the same unit rate.
Use grocery ads to find cost per item, then write an equation relating number of items to total cost.
Free download
Printable 7.RP.A.2b Worksheet
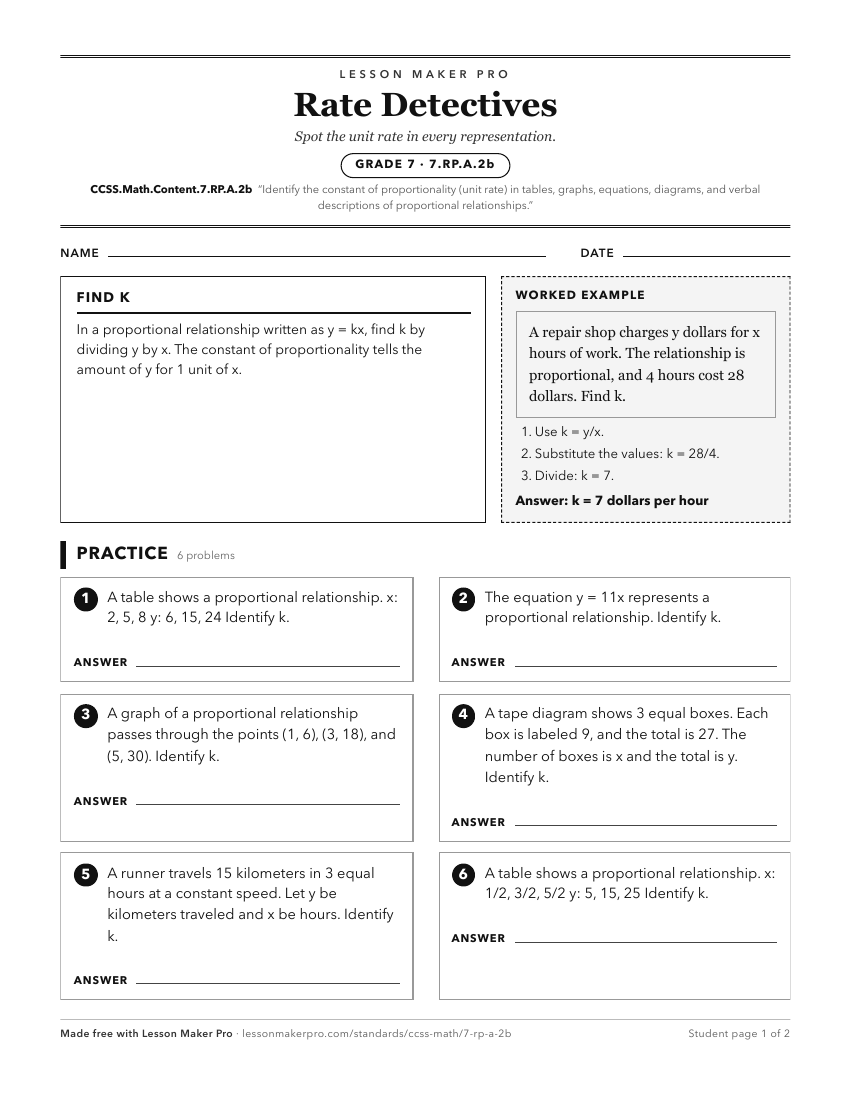
A ready-to-print activity worksheet aligned to CCSS.Math.Content.7.RP.A.2b, with an answer key for the teacher on its own page. No account needed.
PDF, US Letter, prints cleanly in black and white.
Download the worksheetLearning progression
Where This Standard Sits
Before This Standard
If students are struggling here, check these first.
- CCSS.Math.Content.6.RP.A.2
Students must understand unit rate as per-one value before recognizing it as the constant across tables, graphs, equations, and descriptions.
- CCSS.Math.Content.6.RP.A.3a
Making equivalent-ratio tables and graphs supports seeing the shared unit rate that becomes the constant of proportionality.
- CCSS.Math.Content.7.RP.A.2a
Testing for proportionality helps students see why a single unit rate stays constant across tables, graphs, equations, and contexts.
What This Unlocks
Mastery here sets students up for these next.
- CCSS.Math.Content.8.EE.B.5
Students must identify the unit rate across representations before using it as graph slope and comparing proportional relationships.
- CCSS.Math.Content.7.RP.A.2c
Writing y = kx depends on finding the constant of proportionality from tables, graphs, diagrams, or descriptions.
- CCSS.Math.Content.7.RP.A.2d
Recognizing the unit rate helps students explain why (1, r) shows the amount for one x-value on the graph.
- CCSS.Math.Content.8.F.A.2
Finding unit rates across tables, graphs, equations, and words supports comparing function rates and features across different representations.
Keep exploring
Related Standards
Turn this exact standard into a lesson
Grade, subject, topic, and the complete standard are prefilled. Create one free, no account needed.
Also for this standard:Make a WorksheetMake a QuizMake a Sub Lesson