CCSS.
The Standard
Make tables of equivalent ratios relating quantities with whole number measurements, find missing values in the tables, and plot the pairs of values on the coordinate plane. Use tables to compare ratios.
Common Core State Standards for Mathematics
Teacher's field guide
What This Standard Means
What Students Need to Do
- Students make and complete tables that show equivalent ratios using whole-number quantities. They plot each pair as an ordered pair and use matching values to compare ratios.
What Mastery Looks Like
- Students complete ratio tables accurately and explain how each row comes from multiplying both quantities by the same factor. They plot the pairs correctly and use equivalent rows to compare two ratios.
Common Misconceptions
- Students may add the same amount to both quantities instead of multiplying both by the same factor. They may scale only one column, reverse coordinates, or compare table entries that do not share a common quantity.
How to Assess It
- Exit ticket: Recipe A uses 2 cups juice for 3 cups water. Recipe B uses 3 cups juice for 5 cups water. Extend both tables to 6 cups juice, choose the stronger mix, and plot Recipe A's pairs.
Lesson moves
Ways to Teach It
Build trains with 2 red cubes for every 3 blue cubes, then record and plot totals for one through five trains.
Compare two ratio tables for paint mixtures and write which mixture is bluer, using one pair of equivalent ratios as evidence.
Run a missing-value relay where teams complete ratio tables, check both columns, and explain the scale factor before passing.
Compare grocery prices by making tables for different numbers of items, then decide which package gives the better value.
Free download
Printable 6.RP.A.3a Worksheet
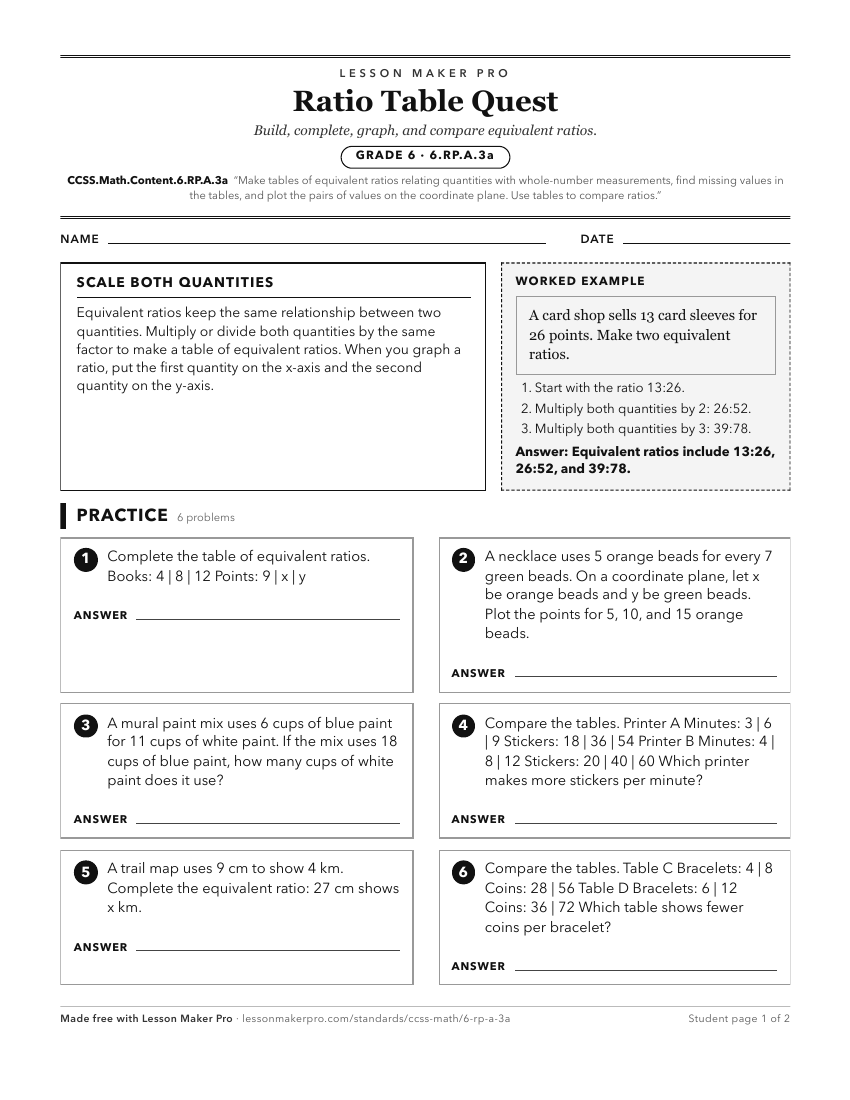
A ready-to-print activity worksheet aligned to CCSS.Math.Content.6.RP.A.3a, with an answer key for the teacher on its own page. No account needed.
PDF, US Letter, prints cleanly in black and white.
Download the worksheetLearning progression
Where This Standard Sits
Before This Standard
If students are struggling here, check these first.
- CCSS.Math.Content.6.RP.A.1
Students need to understand what a ratio compares before generating equivalent ratio tables, missing values, graphs, and comparisons.
- CCSS.Math.Content.5.G.A.1
Understanding axes, origin, and ordered pairs supports plotting ratio table values as coordinate pairs, though ratio reasoning develops separately.
- CCSS.Math.Content.5.OA.B.3
Generating paired values from rules and graphing them supports ratio tables, missing entries, and plotting quantity pairs.
What This Unlocks
Mastery here sets students up for these next.
- CCSS.Math.Content.7.RP.A.2b
Making equivalent-ratio tables and graphs supports seeing the shared unit rate that becomes the constant of proportionality.
- CCSS.Math.Content.7.RP.A.2a
Students use equivalent-ratio tables and plotted pairs to test whether a relationship keeps one constant ratio through the origin.
- CCSS.Math.Content.7.RP.A.2
Equivalent ratio tables and plotted pairs become the main evidence students use to identify and represent proportional relationships.
Keep exploring
Related Standards
- CCSS.Math.Content.6.RP.A.3
Use ratio and rate reasoning to solve real-world and mathematical problems, e.g., by reasoning about tables of equivalent ratios, tape diagrams, double number l...
- CCSS.Math.Content.4.MD.B.4
Make a line plot to display a data set of measurements in fractions of a unit (1/2, 1/4, 1/8). Solve problems involving addition and subtraction of fractions by...
Turn this exact standard into a lesson
Grade, subject, topic, and the complete standard are prefilled. Create one free, no account needed.
Also for this standard:Make a WorksheetMake a QuizMake a Sub Lesson