CCSS.
The Standard
Decide whether two quantities are in a proportional relationship, e.g., by testing for equivalent ratios in a table or graphing on a coordinate plane and observing whether the graph is a straight line through the origin.
Common Core State Standards for Mathematics
Teacher's field guide
What This Standard Means
What Students Need to Do
- Students decide whether two quantities keep the same ratio as values change. They test values in tables and inspect graphs for a straight line that passes through the origin.
What Mastery Looks Like
- Students correctly classify tables and graphs as proportional or not proportional. They calculate and compare ratios, then explain how a constant ratio or a line through the origin supports their decision.
Common Misconceptions
- Students may call any straight line proportional, even when it does not pass through (0,0). They may compare equal differences instead of equal ratios. Some check only one pair of values and assume the whole relationship is proportional.
How to Assess It
- Exit ticket: A table has x values 2, 4, 6 and y values 5, 10, 16. Decide whether the relationship is proportional and justify your answer with ratios.
Lesson moves
Ways to Teach It
Have groups mix colored water using repeated 1 cup to 3 cup batches, record totals, and plot the ordered pairs.
Ask students to explain why a straight line crossing the y-axis at 2 does not show a proportional relationship.
Give pairs a card sort with tables and graphs, then require one ratio or graph feature to justify each match.
Compare taxi fares with a starting fee to grocery costs by weight, then decide which situation is proportional.
Free download
Printable 7.RP.A.2a Worksheet
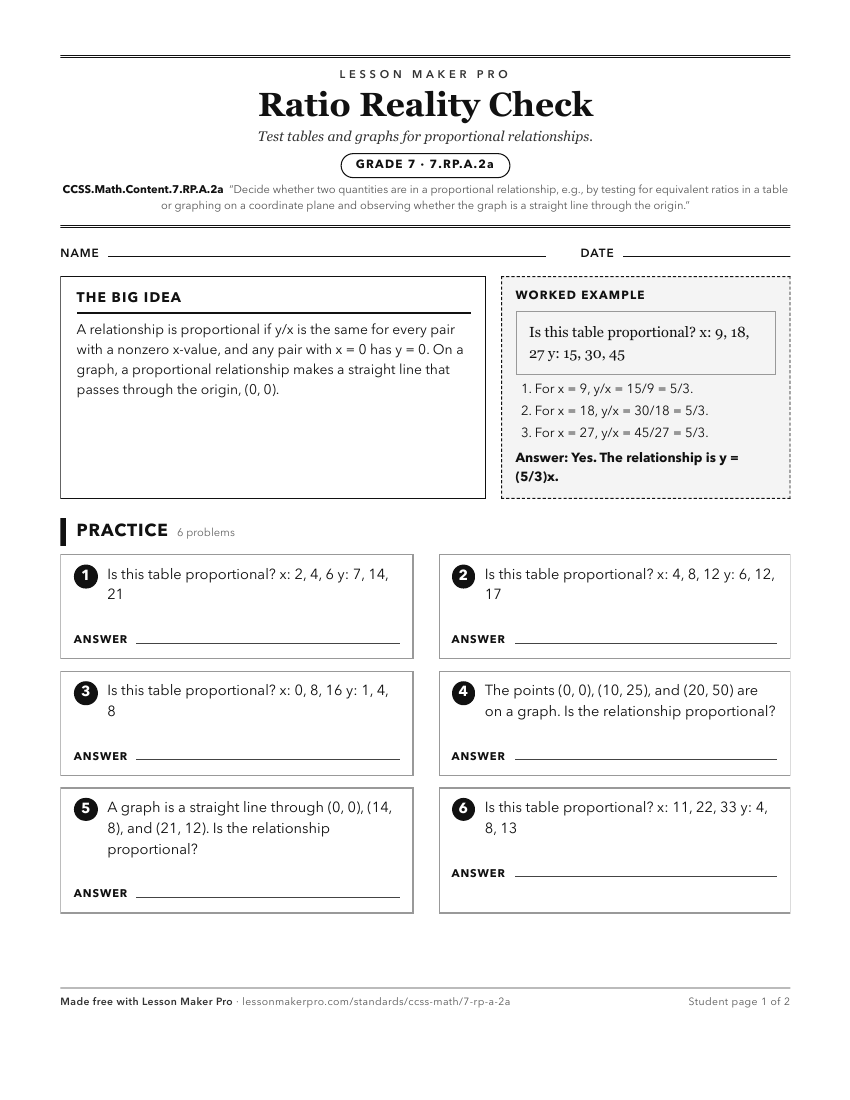
A ready-to-print activity worksheet aligned to CCSS.Math.Content.7.RP.A.2a, with an answer key for the teacher on its own page. No account needed.
PDF, US Letter, prints cleanly in black and white.
Download the worksheetLearning progression
Where This Standard Sits
Before This Standard
If students are struggling here, check these first.
- CCSS.Math.Content.6.RP.A.1
Students must understand ratios between quantities before testing whether all ratios in a table are equivalent.
- CCSS.Math.Content.6.RP.A.3a
Students use equivalent-ratio tables and plotted pairs to test whether a relationship keeps one constant ratio through the origin.
- CCSS.Math.Content.5.G.A.1
Reading and plotting ordered pairs, axes, and the origin supports using graphs to identify proportional relationships as lines through zero.
What This Unlocks
Mastery here sets students up for these next.
- CCSS.Math.Content.8.SP.A.2
Recognizing straight-line relationships on coordinate graphs supports seeing linear patterns in scatter plots, though statistical fit is a new idea.
- CCSS.Math.Content.7.RP.A.2b
Testing for proportionality helps students see why a single unit rate stays constant across tables, graphs, equations, and contexts.
Keep exploring
Related Standards
- CCSS.Math.Content.7.RP.A.2
Recognize and represent proportional relationships between quantities.
- CCSS.Math.Content.8.EE.B.5
Graph proportional relationships, interpreting the unit rate as the slope of the graph. Compare two different proportional relationships represented in differen...
- CCSS.Math.Content.7.RP.A.2c
Represent proportional relationships by equations.
Turn this exact standard into a lesson
Grade, subject, topic, and the complete standard are prefilled. Create one free, no account needed.
Also for this standard:Make a WorksheetMake a QuizMake a Sub Lesson