CCSS.
The Standard
Graph proportional relationships, interpreting the unit rate as the slope of the graph. Compare two different proportional relationships represented in different ways.
Common Core State Standards for Mathematics · Expressions and Equations
Teacher's field guide
What This Standard Means
What Students Need to Do
- Students plot proportional pairs on a coordinate plane and identify the constant rate as the line’s slope. They compare rates shown in equations, tables, graphs, and written descriptions.
What Mastery Looks Like
- Students plot a proportional relationship as a straight line through the origin with accurate axis labels and scales. They find its slope from two points and use unit rates to compare relationships shown in different forms.
Common Misconceptions
- Students may divide change in x by change in y instead of using change in y over change in x. They may judge steepness without checking axis scales, or call any straight line proportional even when it does not pass through the origin.
How to Assess It
- Exit ticket: Runner A follows d = 6t. Runner B’s graph passes through (0, 0) and (3, 15). Graph Runner A, find both slopes, and explain who is faster.
Lesson moves
Ways to Teach It
Measure a toy car’s distance at equal time intervals, graph the data, and compare its slope with another car’s slope.
Ask students to write: How can two graphs look equally steep but represent different rates because their axis scales differ?
Give pairs of equation, table, and graph cards, then have teams match equal rates and rank all relationships by slope.
Compare two hourly pay offers, one shown in a table and one by an equation, and decide which pays more per hour.
Free download
Printable 8.EE.B.5 Worksheet
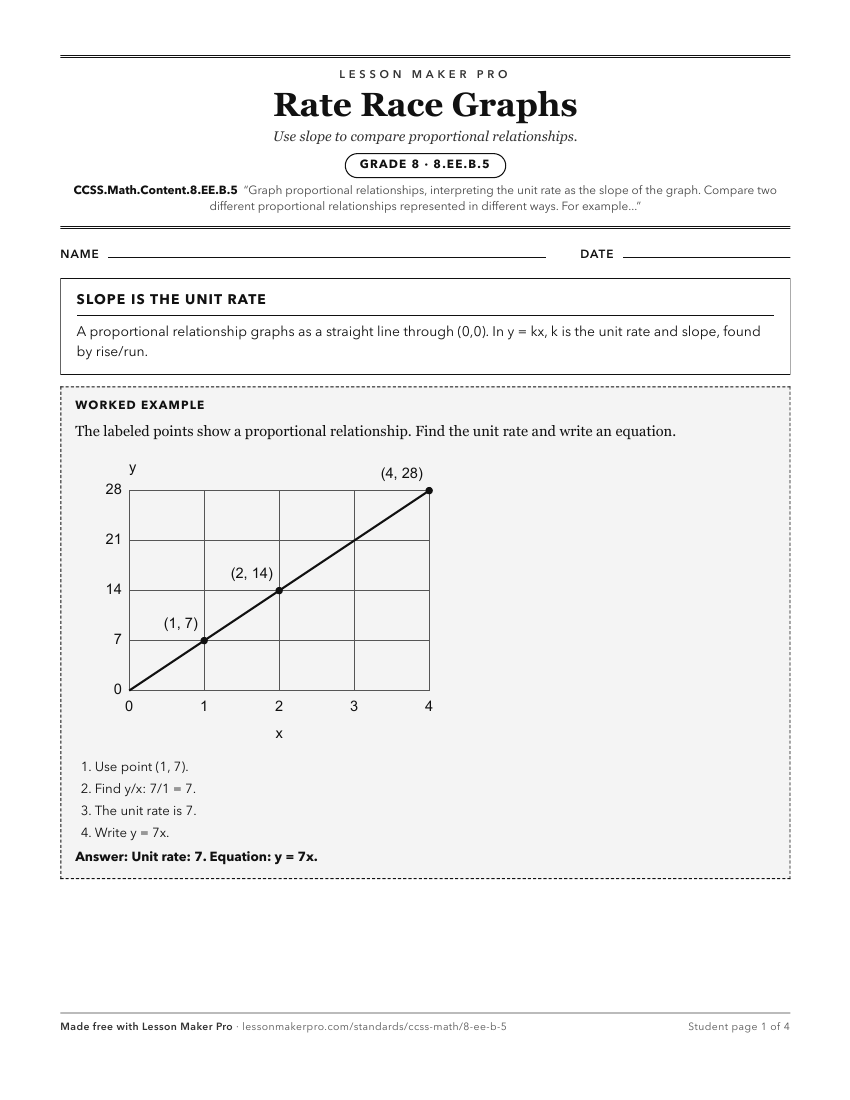
A ready-to-print activity worksheet aligned to CCSS.Math.Content.8.EE.B.5, with an answer key for the teacher on its own page. No account needed.
PDF, US Letter, prints cleanly in black and white.
Download the worksheetLearning progression
Where This Standard Sits
See the whole path on the Expressions & Equations progression map.
Before This Standard
If students are struggling here, check these first.
- CCSS.Math.Content.7.RP.A.2
Students must understand constants of proportionality and representations before interpreting that constant as graph slope and comparing forms.
- CCSS.Math.Content.7.RP.A.2b
Students must identify the unit rate across representations before using it as graph slope and comparing proportional relationships.
- CCSS.Math.Content.7.RP.A.2d
Understanding points like (1, r) as unit rate supports seeing the same rate as slope on proportional graphs.
What This Unlocks
Mastery here sets students up for these next.
- CCSS.Math.Content.8.EE.B.6
Interpreting unit rate as slope prepares students to see constant rise over run and connect proportional graphs to linear equations.
- CCSS.Math.Content.HSF-LE.A.1b
Unit rate as slope in proportional graphs supports recognizing a constant rate of change in broader linear situations.
- CCSS.Math.Content.8.F.A.2
Comparing unit rates and slopes across graphs, tables, and equations supports later comparisons of function properties across representations.
- CCSS.Math.Content.8.SP.A.2
Understanding slope and straight-line graphs for proportional relationships helps students interpret and draw informal linear models on scatter plots.
Keep exploring
Related Standards
Turn this exact standard into a lesson
Grade, subject, topic, and the complete standard are prefilled. Create one free, no account needed.
Also for this standard:Make a WorksheetMake a QuizMake a Sub Lesson