CCSS.
The Standard
Explain what a point (x, y) on the graph of a proportional relationship means in terms of the situation, with special attention to the points (0, 0) and (1, r) where r is the unit rate.
Common Core State Standards for Mathematics
Teacher's field guide
What This Standard Means
What Students Need to Do
- Students connect a plotted coordinate pair to the two quantities named on the axes. They explain what zero units means and use the point at one x-unit to identify the unit rate.
What Mastery Looks Like
- Students label both axes with quantities and units, then explain a plotted pair in context. They identify the origin as zero of both quantities and use the point where x equals 1 to state the unit rate.
Common Misconceptions
- Students may switch the meanings of the x and y coordinates or treat each coordinate separately. They may think (0, 0) is just a starting point and miss that (1, r) gives the amount for one unit.
How to Assess It
- Show a graph for apples priced at $4 per pound. Ask students to explain what (3, 12), (0, 0), and (1, 4) mean in this situation.
Lesson moves
Ways to Teach It
Give students price cards and masking tape axes, then have them place cards at matching points and explain each coordinate pair.
Display a graph of gallons and miles, then ask: What does each coordinate in (5, 150) tell us?
Play Point Interpreter: teams draw coordinate cards, locate each point on a proportional graph, and earn points for accurate context statements.
Use a grocery price graph to compare pounds purchased, total cost, the zero point, and the cost of one pound.
Free download
Printable 7.RP.A.2d Worksheet
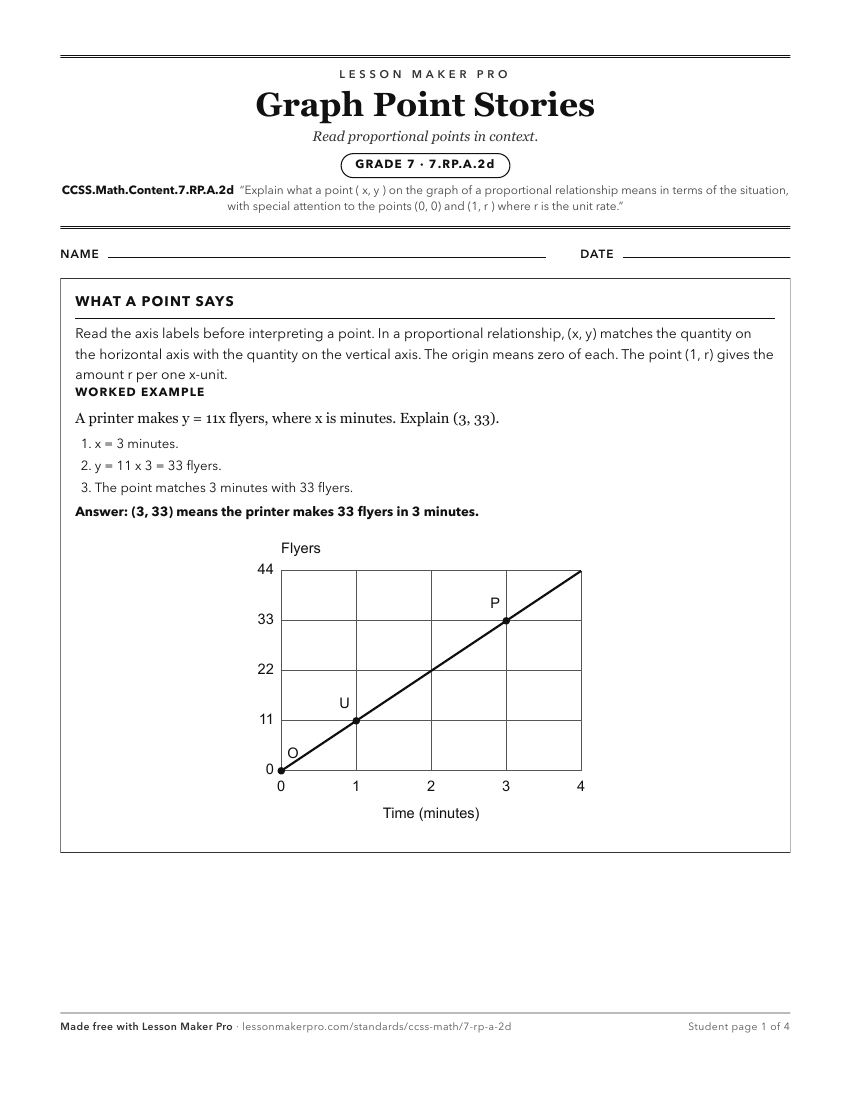
A ready-to-print activity worksheet aligned to CCSS.Math.Content.7.RP.A.2d, with an answer key for the teacher on its own page. No account needed.
PDF, US Letter, prints cleanly in black and white.
Download the worksheetLearning progression
Where This Standard Sits
Before This Standard
If students are struggling here, check these first.
- CCSS.Math.Content.5.G.A.2
Students must read coordinate pairs as contextual quantities before explaining proportional graph points, including unit-rate and origin meanings.
- CCSS.Math.Content.6.RP.A.2
Interpreting (1, r) on a proportional graph requires knowing that r is the unit rate for one unit of x.
- CCSS.Math.Content.7.RP.A.2b
Recognizing the unit rate helps students explain why (1, r) shows the amount for one x-value on the graph.
What This Unlocks
Mastery here sets students up for these next.
Keep exploring
Related Standards
Turn this exact standard into a lesson
Grade, subject, topic, and the complete standard are prefilled. Create one free, no account needed.
Also for this standard:Make a WorksheetMake a QuizMake a Sub Lesson