Alabama Math 6.DSP.A
Standard Cluster
Use real-world and mathematical problems to analyze data and demonstrate an understanding of statistical variability and measures of center.
2019 Alabama Course of Study: Mathematics
Cluster contents
Standards in This Cluster
6.DSP.A is a cluster heading. These are the individual standards under it.
- 6.DSP.A.22
Write examples and non-examples of statistical questions, explaining that a statistical question anticipates variability in the data related to the question.
- 6.DSP.A.23
Calculate, interpret, and compare measures of center (mean, median, mode) and variability (range and interquartile range) in real-world data sets.
- 6.DSP.A.23.a
Determine which measure of center best represents a real-world data set.
- 6.DSP.A.23.b
Interpret the measures of center and variability in the context of a problem.
- 6.DSP.A.24
Represent numerical data graphically, using dot plots, line plots, histograms, stem and leaf plots, and box plots.
- 6.DSP.A.24.a
Analyze the graphical representation of data by describing the center, spread, shape (including approximately symmetric or skewed), and unusual features (includ...
- 6.DSP.A.24.b
Use graphical representations of real-world data to describe the context from which they were collected.
Teacher's field guide
What This Cluster Means
What Students Need to Do
- Students find the mean and median of a data set. They describe how spread out the values are and use the results to answer a question about the data.
What Mastery Looks Like
- A student can calculate the mean, median, and range accurately. They can explain why the median may describe a typical value better when one value is much higher or lower than the rest.
Common Misconceptions
- Students may find the median without putting the numbers in order. They may confuse the range with the largest value or think the mean must be one of the values in the data set.
How to Assess It
- Five students waited 2, 3, 4, 5, and 16 minutes for a bus. Find the mean, median, and range, then explain which center better describes a typical wait.
Lesson moves
Ways to Teach It
Give pairs cube stacks of heights 2, 3, 4, 5, and 16; have them move cubes between stacks to model the mean.
Compare bus waits of 4, 5, 6 minutes with 1, 5, 9 minutes. Which route is more predictable? Explain.
Play Mean, Median, Range Bingo with five-number data cards; students calculate each measure and cover matching values on a bingo grid.
Post daily temperatures of 58, 60, 61, 62, and 79 degrees; have students choose a typical temperature and explain the spread.
Free download
Printable 6.DSP.A Worksheet
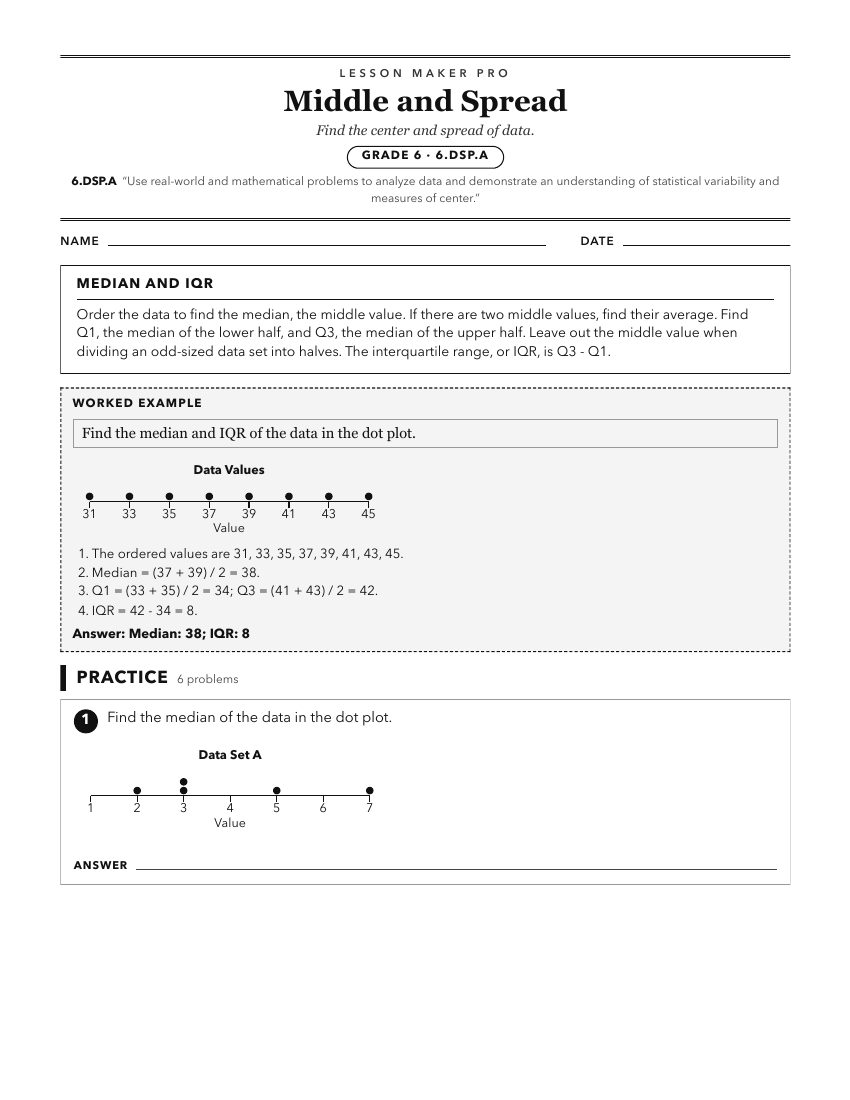
A ready-to-print activity worksheet aligned to 6.DSP.A, with an answer key for the teacher on its own page. No account needed.
PDF, US Letter, prints cleanly in black and white.
Download the worksheetKeep exploring
Related Standards
Turn this cluster into a lesson
Grade, subject, topic, and the complete cluster are prefilled. Create one free, no account needed.
Also for this cluster:Make a WorksheetMake a QuizMake a Sub Lesson