Alabama Math 6.DSP.A.24.b
The Standard
- 6.DSP.A
- Use real-world and mathematical problems to analyze data and demonstrate an understanding of statistical variability and measures of center.
- 6.DSP.A.24
- Represent numerical data graphically, using dot plots, line plots, histograms, stem and leaf plots, and box plots.
Use graphical representations of real-world data to describe the context from which they were collected.
2019 Alabama Course of Study: Mathematics
Teacher's field guide
What This Standard Means
What Students Need to Do
- Students read graphs of real data and identify what was measured and the units used. They describe common values, the range, and unusual values in terms of the situation.
What Mastery Looks Like
- Given a graph of bus ride times, a student can say how long most rides took and name the shortest and longest times in minutes. They know the graph does not show why a ride took longer.
Common Misconceptions
- Students may say a graph goes up without naming what the numbers measure. They may treat the highest value as typical or assume the graph proves why it happened.
How to Assess It
- Display a dot plot titled “Minutes seven students read last night” with dots at 0, 10, 10, 20, 20, 20, and 30. Ask students to name the most common reading time and describe the range in a sentence.
Lesson moves
Ways to Teach It
Have students time how long they take to stack 10 cups, then build a class dot plot and describe the times.
Show a graph of lunch line wait times and ask students to write what it shows about waiting, not why waits vary.
Give pairs three labeled graphs and three short descriptions; have them match each description to a graph and point to supporting values.
Use last week's recorded high temperatures from a weather site to make a line graph and describe the warmest and coolest days.
Free download
Printable 6.DSP.A.24.b Worksheet
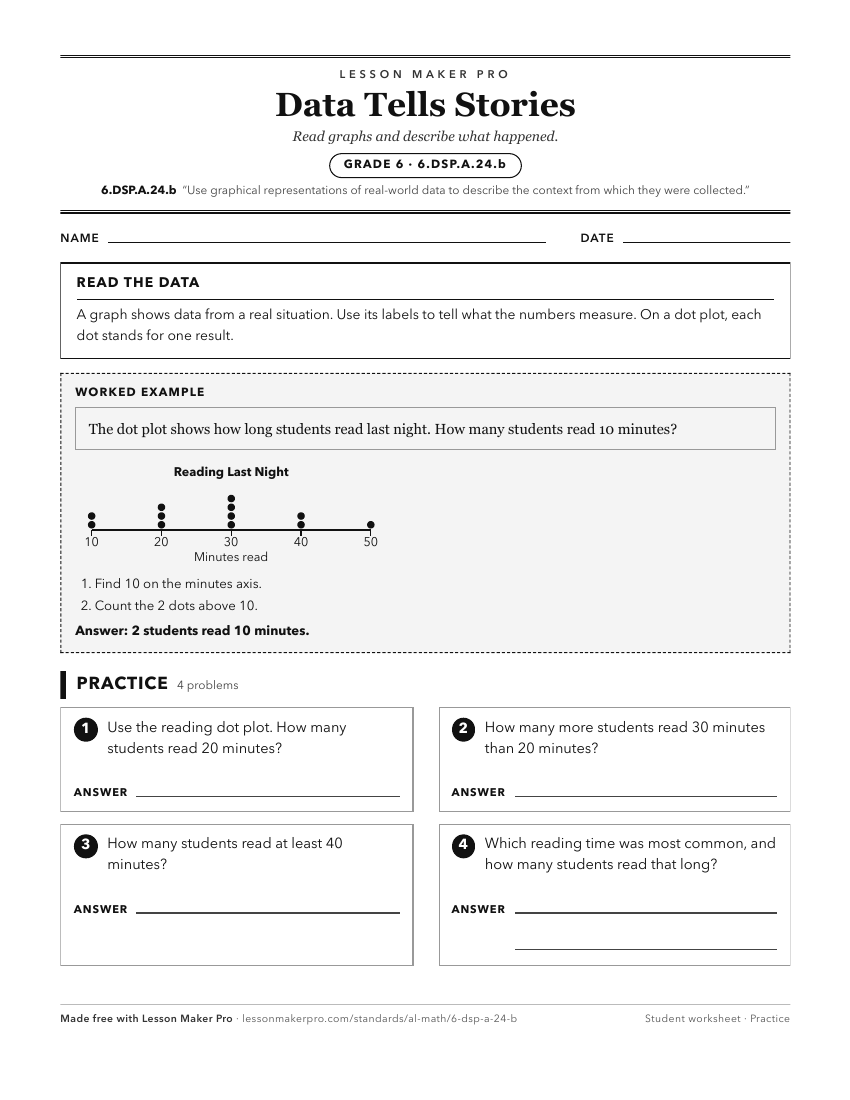
A ready-to-print activity worksheet aligned to 6.DSP.A.24.b, with an answer key for the teacher on its own page. No account needed.
PDF, US Letter, prints cleanly in black and white.
Download the worksheetKeep exploring
Related Standards
- 1.DA.A.16.b
Summarize data on Venn diagrams, pictographs, and "yes-no" charts using real objects, symbolic representations, or pictorial representations.
- K.DA.A.15.a
Categorize data on Venn diagrams, pictographs, and "yes-no" charts using real objects, symbolic representations, or pictorial representations.
- 3.DA.A.16
For a given or collected set of data, create a scaled (one-to-many) picture graph and scaled bar graph to represent a data set with several categories.
- 6.DSP.A.24
Represent numerical data graphically, using dot plots, line plots, histograms, stem and leaf plots, and box plots.
Turn this exact standard into a lesson
Grade, subject, topic, and the complete standard are prefilled. Create one free, no account needed.
Also for this standard:Make a WorksheetMake a QuizMake a Sub Lesson