Alabama Math 1.DA.A.16.b
The Standard
- 1.DA.A
- Collect and analyze data and interpret results.
- 1.DA.A.16
- Organize, represent, and interpret data with up to three categories.
Summarize data on Venn diagrams, pictographs, and "yes-no" charts using real objects, symbolic representations, or pictorial representations.
2019 Alabama Course of Study: Mathematics
Teacher's field guide
What This Standard Means
What Students Need to Do
- Students sort objects or answers and show each one with a picture or mark. They count each group and tell which has more, fewer, or the same number.
What Mastery Looks Like
- A student puts red circles in the shared part of a diagram labeled red and circle. They read a picture graph or yes/no chart, give each count, and explain which group has more.
Common Misconceptions
- Students may put an item that fits both labels in only one circle. They may skip pictures when counting or treat a blank space as a no answer.
How to Assess It
- Draw a chart with five dots under Yes and three under No. Ask, "How many children answered? Which answer has more, and how many more?"
Lesson moves
Ways to Teach It
Give pairs red and blue paper circles and squares to sort into overlapping hoops labeled red and circle.
Show a picture graph with four apple pictures and two banana pictures; ask, "How do you know which fruit got more votes?"
Play chart swap: pairs flip six yes/no cards, mark a two-column chart, then trade charts and compare the counts.
Ask classmates, "Did you walk to school today?" Record answers with sticky notes, then compare the yes and no totals.
Free download
Printable 1.DA.A.16.b Worksheet
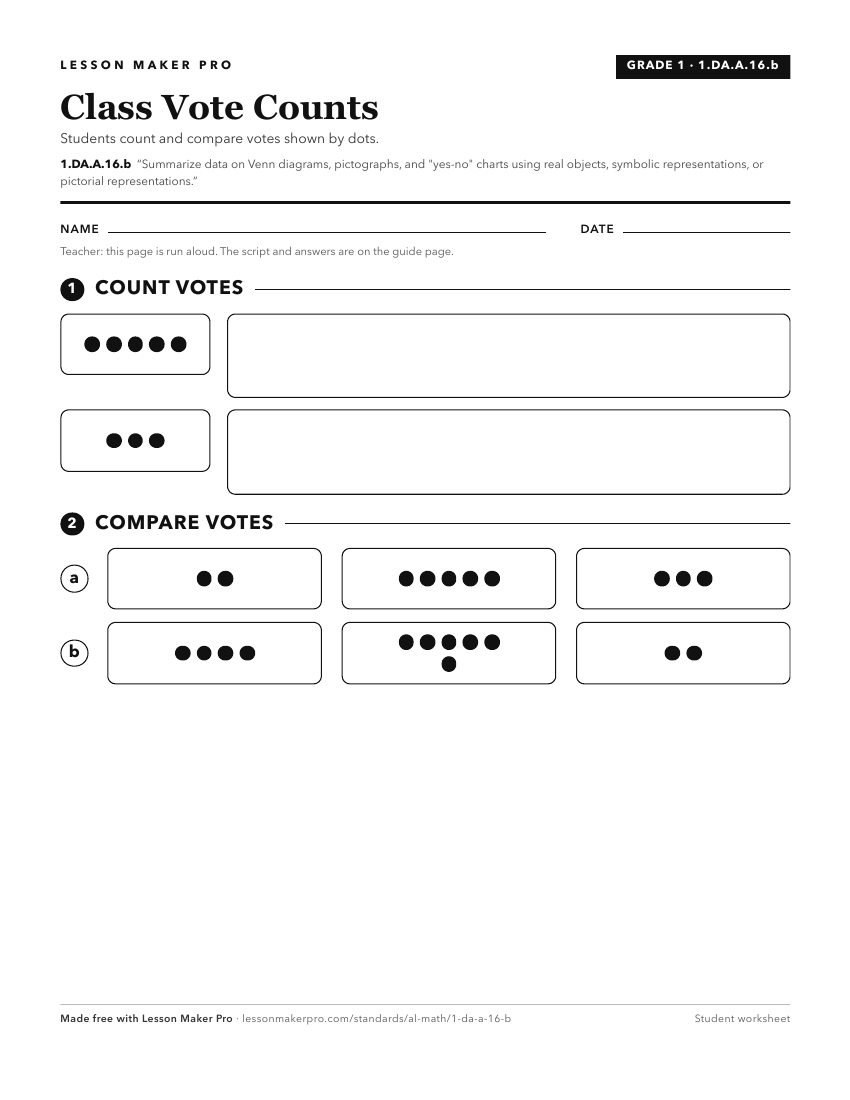
A ready-to-print activity worksheet aligned to 1.DA.A.16.b, with an answer key for the teacher on its own page. No account needed.
PDF, US Letter, prints cleanly in black and white.
Download the worksheetKeep exploring
Related Standards
- K.DA.A.15.a
Categorize data on Venn diagrams, pictographs, and "yes-no" charts using real objects, symbolic representations, or pictorial representations.
- 6.DSP.A.24.b
Use graphical representations of real-world data to describe the context from which they were collected.
- 6.DSP.A.24
Represent numerical data graphically, using dot plots, line plots, histograms, stem and leaf plots, and box plots.
- 1.DA.A.16
Organize, represent, and interpret data with up to three categories.
Turn this exact standard into a lesson
Grade, subject, topic, and the complete standard are prefilled. Create one free, no account needed.
Also for this standard:Make a WorksheetMake a QuizMake a Sub Lesson