Alabama Math 1.DA.A.16
Standard Cluster
- 1.DA.A
- Collect and analyze data and interpret results.
Organize, represent, and interpret data with up to three categories. a. Ask and answer questions about the total number of data points in organized data. b. Summarize data on Venn diagrams, pictographs, and "yes-no" charts using real objects, symbolic representations, or pictorial representations. c. Determine “how many” in each category using up to three categories of data. d. Determine “how many more” or “how many less” are in one category than in another using data organized into two or three categories.
2019 Alabama Course of Study: Mathematics · Data Analysis
Cluster contents
Standards in This Cluster
1.DA.A.16 is a cluster heading. These are the individual standards under it.
- 1.DA.A.16.a
Ask and answer questions about the total number of data points in organized data.
- 1.DA.A.16.b
Summarize data on Venn diagrams, pictographs, and "yes-no" charts using real objects, symbolic representations, or pictorial representations.
- 1.DA.A.16.c
Determine "how many" in each category using up to three categories of data.
- 1.DA.A.16.d
Determine "how many more" or "how many less" are in one category than in another using data organized into two or three categories.
Teacher's field guide
What This Cluster Means
What Students Need to Do
- Students sort items or collect votes in up to three groups. They show the results with objects, pictures, Venn diagrams, or yes-no charts. They count the total and tell how many more or fewer are in one group.
What Mastery Looks Like
- A student records one mark or picture for each item and counts each group correctly. They find the total and the difference between two groups. On a Venn diagram, they count an item in the overlap only once when finding the total.
Common Misconceptions
- Students may count an item in the Venn overlap twice when finding the total. They may give the size of the larger group instead of finding how many more it has. Some skip a vote when turning objects into pictures.
How to Assess It
- Exit ticket: Draw one picture per vote for cats 5, dogs 3, and fish 2. Write how many votes there are altogether and how many more chose cats than fish.
Lesson moves
Ways to Teach It
Give pairs red and blue buttons with mixed holes; sort them on a Venn mat labeled red and two holes, then count each button once.
Show a pictograph with six cracker votes, four grape votes, and three cheese votes; ask, 'How many more chose crackers than grapes? Explain.'
Play chart swap: ask six classmates 'Do you have a pet?', mark yes or no, then trade charts and find both counts.
Count crayons in red, blue, and green bins; chart each count to see which bin needs refilling first.
Free download
Printable 1.DA.A.16 Worksheet
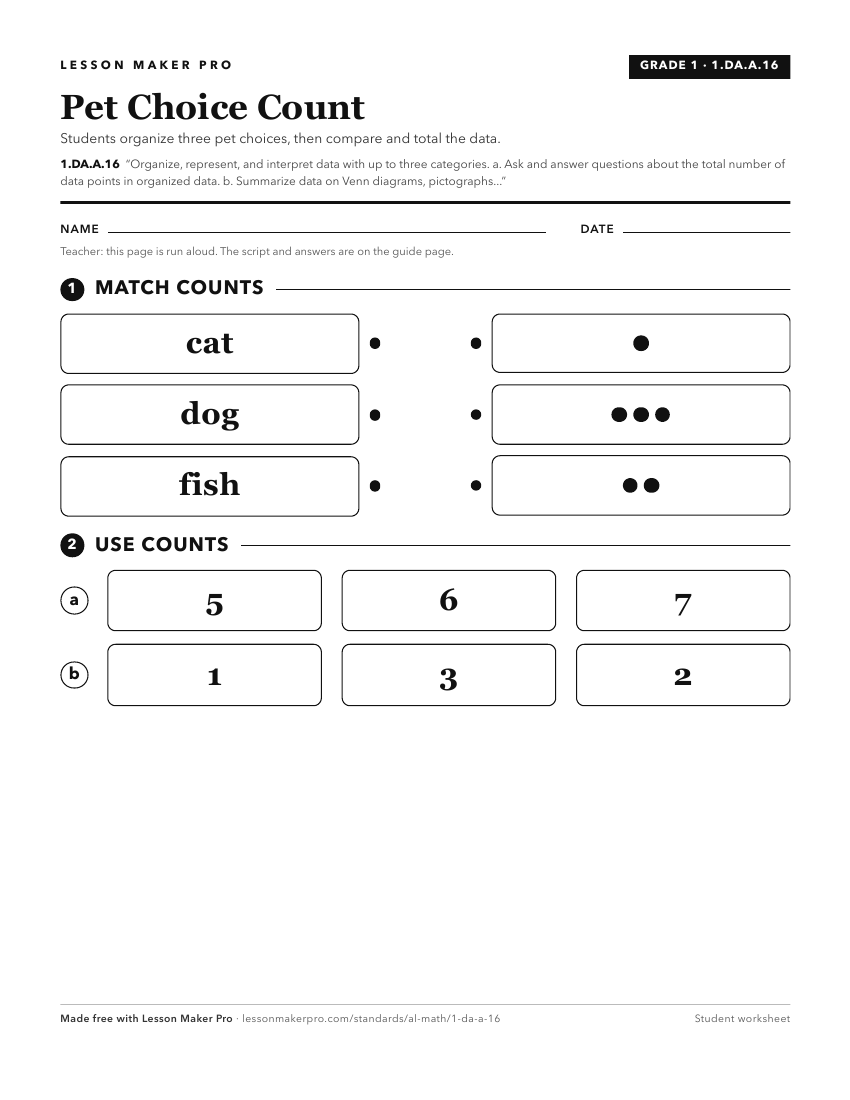
A ready-to-print activity worksheet aligned to 1.DA.A.16, with an answer key for the teacher on its own page. No account needed.
PDF, US Letter, prints cleanly in black and white.
Download the worksheetKeep exploring
Related Standards
Turn this cluster into a lesson
Grade, subject, topic, and the complete cluster are prefilled. Create one free, no account needed.
Also for this cluster:Make a WorksheetMake a QuizMake a Sub Lesson