Alabama Math 1.DA.A.16.c
The Standard
- 1.DA.A
- Collect and analyze data and interpret results.
- 1.DA.A.16
- Organize, represent, and interpret data with up to three categories.
Determine “how many” in each category using up to three categories of data.
2019 Alabama Course of Study: Mathematics
Teacher's field guide
What This Standard Means
What Students Need to Do
- Students sort objects or responses into up to three groups. They count how many are in each group and say or write each count.
What Mastery Looks Like
- A student can count the items in each group on a picture graph or in a set of sorted objects. They give a separate count for each group.
Common Misconceptions
- Students may give the total number of items instead of a count for each group. They may skip or count an item twice.
How to Assess It
- Draw three rows labeled dog, cat, and fish, with 3, 5, and 2 dots. Ask students to write how many dots are in each row.
Lesson moves
Ways to Teach It
Give pairs 12 cubes in three colors; have them sort by color, count each pile, and record the three counts.
Show a picture graph of favorite fruits and ask, 'How many chose each fruit? How did you count?'
Play Sort and Count: students draw ten colored counters from a bag, sort them by color, and report each count.
Let students choose one of three books for read-aloud, then count and record how many chose each book.
Free download
Printable 1.DA.A.16.c Worksheet
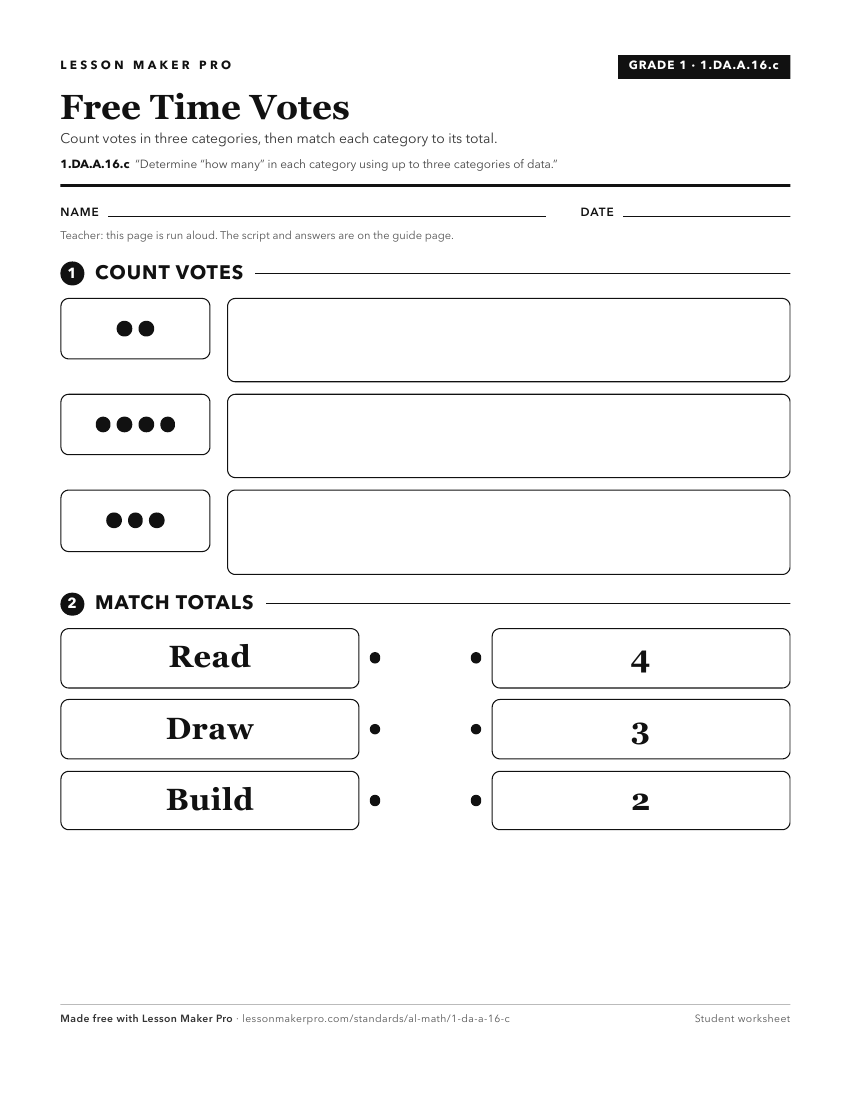
A ready-to-print activity worksheet aligned to 1.DA.A.16.c, with an answer key for the teacher on its own page. No account needed.
PDF, US Letter, prints cleanly in black and white.
Download the worksheetKeep exploring
Related Standards
- 1.DA.A.16.d
Determine "how many more" or "how many less" are in one category than in another using data organized into two or three categories.
- 1.DA.A.16
Organize, represent, and interpret data with up to three categories.
- K.DA.A.15
Classify objects into given categories of 10 or fewer; count the number of objects in each category and sort the categories by count.
- 8A.DSP.C.39.a
Summarize categorical data for two categories in two-way frequency tables and represent using segmented bar graphs.
Turn this exact standard into a lesson
Grade, subject, topic, and the complete standard are prefilled. Create one free, no account needed.
Also for this standard:Make a WorksheetMake a QuizMake a Sub Lesson