Alabama Math 8A.DSP.C.39.a
The Standard
- 8A.DSP.C
- The association between two categorical variables is typically represented by using two-way tables and segmented bar graphs.
- 8A.DSP.C.39
- Analyze the possible association between two categorical variables.
Summarize categorical data for two categories in two-way frequency tables and represent using segmented bar graphs.
2019 Alabama Course of Study: Mathematics · The association between two categorical variables is typically represented by using two-way tables and segmented bar graphs.
Teacher's field guide
What This Standard Means
What Students Need to Do
- Students sort paired responses into a two-way table and check the row and column totals. They turn each group's counts into percentages and draw segmented bars that add to 100%.
What Mastery Looks Like
- A student places each response in the right table cell and checks that the totals match the data. Their bars show the correct percentages, and they can use them to compare groups of different sizes.
Common Misconceptions
- Students may count one response in two cells or mix up which variable defines the bars. They may compare raw counts when group sizes differ or draw bars whose sections do not add to 100%.
How to Assess It
- Tell students that 8 of 10 bus riders and 3 of 6 walkers bring lunch from home. Ask them to complete a two-way table, draw two 100% segmented bars, and name which group has the larger share bringing lunch.
Lesson moves
Ways to Teach It
Sort 20 cards labeled pet yes/no and sport yes/no into four piles, tally a two-way table, then shade two 100% bars.
Ask: If 8 of 10 bus riders and 3 of 6 walkers bring lunch, which group has the larger share?
Give teams 12 survey cards and have them race to make a matching two-way table and segmented bars.
Count packed and school lunches in two homerooms, then graph each room's lunch split as percentages.
Free download
Printable 8A.DSP.C.39.a Worksheet
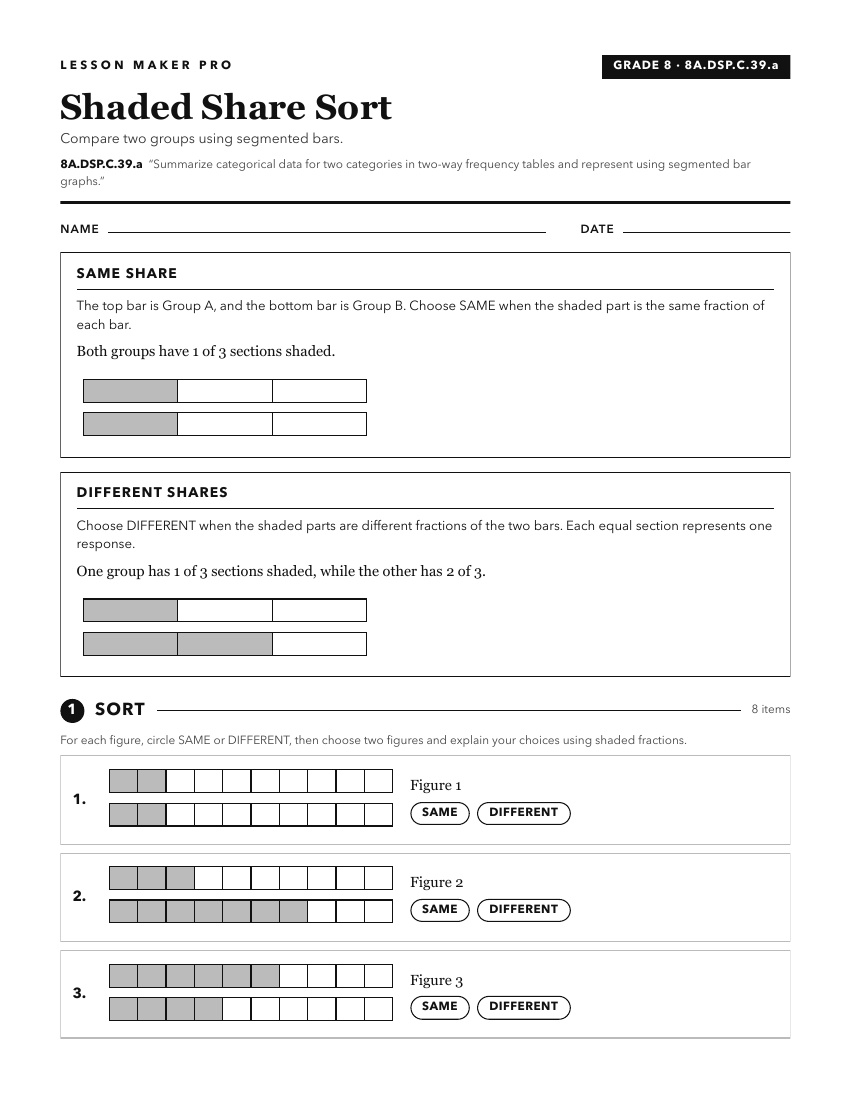
A ready-to-print activity worksheet aligned to 8A.DSP.C.39.a, with an answer key for the teacher on its own page. No account needed.
PDF, US Letter, prints cleanly in black and white.
Download the worksheetKeep exploring
Related Standards
- A1P.DSP.D.35.a
Summarize categorical data for two categories in two-way frequency tables and represent using segmented bar graphs.
- A1P.DSP.D
The association between two categorical variables is typically represented by using two-way tables and segmented bar graphs.
- 8A.DSP.C
The association between two categorical variables is typically represented by using two-way tables and segmented bar graphs.
Turn this exact standard into a lesson
Grade, subject, topic, and the complete standard are prefilled. Create one free, no account needed.
Also for this standard:Make a WorksheetMake a QuizMake a Sub Lesson