Alabama Math A1P.DSP.D
Standard Cluster
The association between two categorical variables is typically represented by using two-way tables and segmented bar graphs.
2019 Alabama Course of Study: Mathematics · Algebra I With Probability
Cluster contents
Standards in This Cluster
A1P.DSP.D is a cluster heading. These are the individual standards under it.
- A1P.DSP.D.35
Analyze the possible association between two categorical variables.
- A1P.DSP.D.35.a
Summarize categorical data for two categories in two-way frequency tables and represent using segmented bar graphs.
- A1P.DSP.D.35.b
Interpret relative frequencies in the context of categorical data (including joint, marginal, and conditional relative frequencies).
- A1P.DSP.D.35.c
Identify possible associations and trends in categorical data.
Teacher's field guide
What This Cluster Means
What Students Need to Do
- Students count how often pairs of categories occur and record the counts in a two-way table. They use percentages within each group to draw segmented bars and compare the groups.
What Mastery Looks Like
- A student can turn a two-way table into equal-length bars, with each bar totaling 100%. They can tell whether the groups show different patterns and support their answer with percentages.
Common Misconceptions
- Students may compare raw counts even when the groups have different sizes. They may draw bars from counts instead of percentages or say that an association proves one trait causes the other.
How to Assess It
- Exit ticket: Of 20 bus riders, 12 pack lunch. Of 20 nonriders, 6 pack lunch. Make a two-way table and a 100% segmented bar graph, then describe the association.
Lesson moves
Ways to Teach It
Survey classmates about bus rides and packed lunches, place responses in four sticky-note boxes, then make a table and 100% bars.
Ask: 'If 12 of 20 bus riders pack lunch and 9 of 30 nonriders do, what do equal-length bars show?'
Give pairs cards with two-way tables and 100% bar graphs; have them match cards and defend each match using percentages.
Post cafeteria counts for packed and purchased lunches in two grades; students graph the percentages and compare packed-lunch rates.
Free download
Printable A1P.DSP.D Worksheet
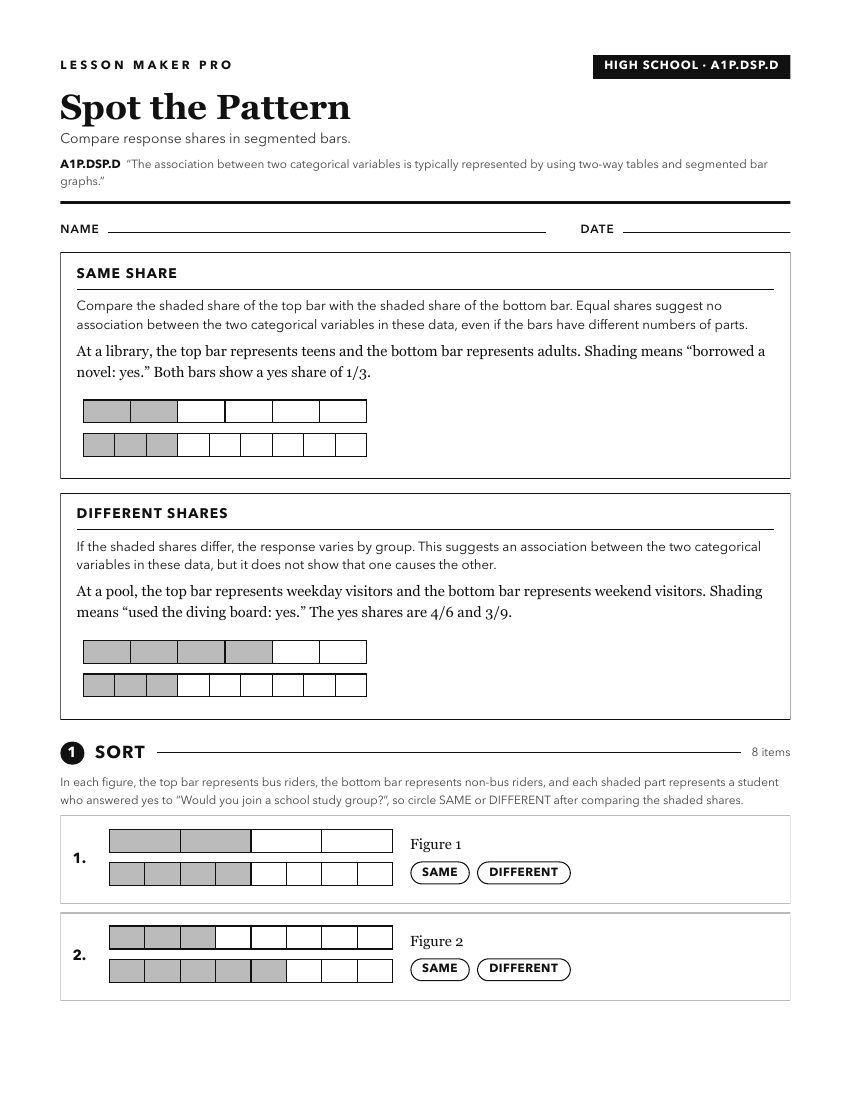
A ready-to-print activity worksheet aligned to A1P.DSP.D, with an answer key for the teacher on its own page. No account needed.
PDF, US Letter, prints cleanly in black and white.
Download the worksheetKeep exploring
Related Standards
Turn this cluster into a lesson
Grade, subject, topic, and the complete cluster are prefilled. Create one free, no account needed.
Also for this cluster:Make a WorksheetMake a QuizMake a Sub Lesson