Alabama Math A1P.DSP.D.35.a
The Standard
- A1P.DSP.D
- The association between two categorical variables is typically represented by using two-way tables and segmented bar graphs.
- A1P.DSP.D.35
- Analyze the possible association between two categorical variables.
Summarize categorical data for two categories in two-way frequency tables and represent using segmented bar graphs.
2019 Alabama Course of Study: Mathematics · The association between two categorical variables is typically represented by using two-way tables and segmented bar graphs.
Teacher's field guide
What This Standard Means
What Students Need to Do
- Students count responses for two categorical variables and organize them in a two-way table. They use the counts to draw segmented bars that show the percentages within each group.
What Mastery Looks Like
- Given lunch choices by grade, a student fills in the table and checks the row and column totals. They draw equal-length bars, label the segments with percentages, and describe a difference between grades.
Common Misconceptions
- Students may place one response in the wrong cell or mix up row and column totals. They may make bars different lengths because the groups have different sizes, or use percentages of the whole class instead of each grade.
How to Assess It
- Exit ticket: Of 10 ninth graders, 6 ride the bus and 4 ride in a car; of 20 tenth graders, 8 ride the bus and 12 ride in a car. Make a two-way table and two 100% segmented bars, then compare bus use by grade.
Lesson moves
Ways to Teach It
Give pairs 30 paper survey slips labeled with grade and ride type; have them sort the slips into a two-way table and build segmented bars with colored strips.
Ask, “Can a grade have more bus riders but a lower percentage of bus riders?” Have students use a completed table to explain their answer.
Run a table-to-bar relay: teams fill missing counts and totals in a two-way table, then color 100-square strips for each grade.
Use anonymized cafeteria counts for lunch type by grade; have students make segmented bars and compare meal choices across grades.
Free download
Printable A1P.DSP.D.35.a Worksheet
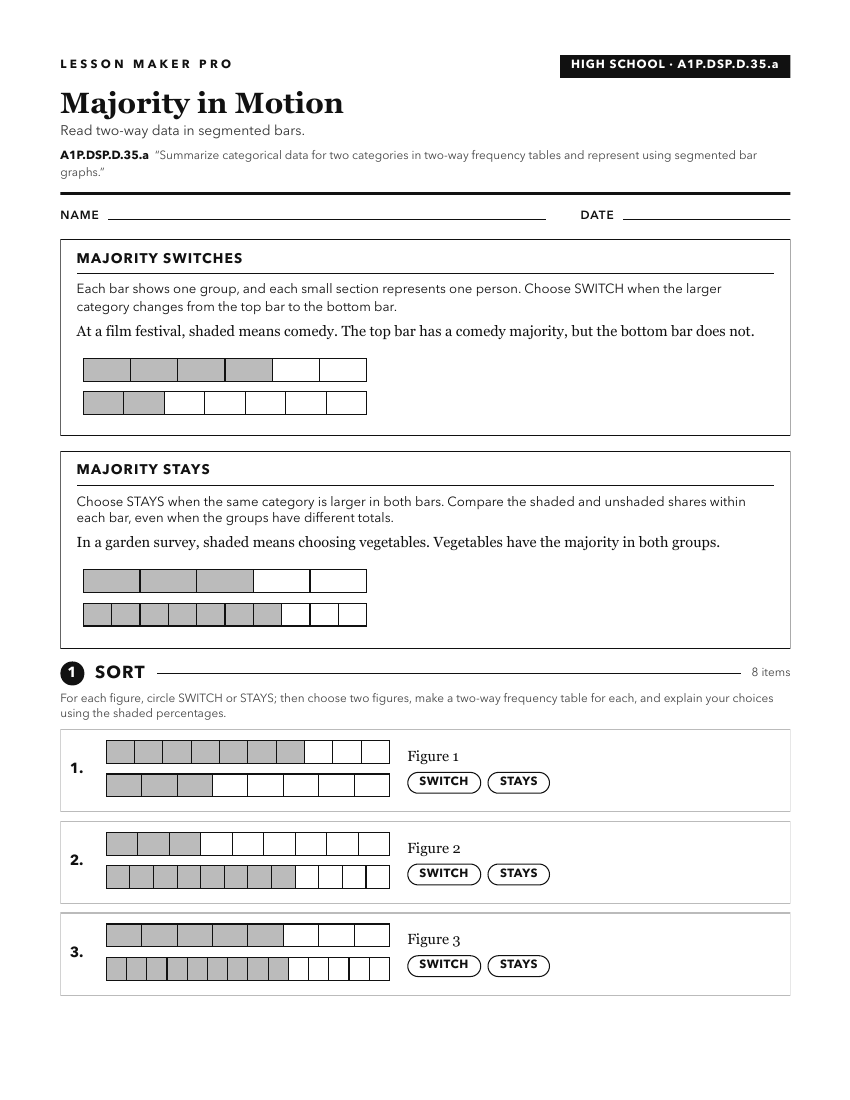
A ready-to-print activity worksheet aligned to A1P.DSP.D.35.a, with an answer key for the teacher on its own page. No account needed.
PDF, US Letter, prints cleanly in black and white.
Download the worksheetKeep exploring
Related Standards
- 8A.DSP.C.39.a
Summarize categorical data for two categories in two-way frequency tables and represent using segmented bar graphs.
- A1P.DSP.D
The association between two categorical variables is typically represented by using two-way tables and segmented bar graphs.
- 8A.DSP.C
The association between two categorical variables is typically represented by using two-way tables and segmented bar graphs.
Turn this exact standard into a lesson
Grade, subject, topic, and the complete standard are prefilled. Create one free, no account needed.
Also for this standard:Make a WorksheetMake a QuizMake a Sub Lesson