Alabama Math K.DA.A.15.a
The Standard
- K.DA.A
- Collect and analyze data and interpret results.
- K.DA.A.15
- Classify objects into given categories of 10 or fewer; count the number of objects in each category and sort the categories by count.
Categorize data on Venn diagrams, pictographs, and "yes-no" charts using real objects, symbolic representations, or pictorial representations.
2019 Alabama Course of Study: Mathematics · Collect and analyze data and interpret results.
Teacher's field guide
What This Standard Means
What Students Need to Do
- Students sort objects or pictures using a Venn diagram, a pictograph, or a yes-no chart. They count each group and tell what the chart shows.
What Mastery Looks Like
- A student puts a red circle in the overlap of a Venn diagram labeled red and circle. They draw one picture for each object in a pictograph and can say which group has more.
Common Misconceptions
- Students may put an object that fits both Venn groups in just one circle. They may draw one picture for a whole group on a pictograph instead of one picture per object. On a yes-no chart, they may sort by what an object looks like rather than by the question.
How to Assess It
- Give students picture cards of a red circle, red square, blue circle, and blue triangle. Ask them to place each on a Venn diagram labeled red and circle, then tell how many are red.
Lesson moves
Ways to Teach It
Give pairs red and blue shape blocks to sort on a floor Venn diagram labeled red and circle.
Draw a pictograph with three apples and two pears, then ask, 'Which fruit has more, and how can you tell?'
Play a yes-no sorting race with toy car, toy train, ball, and block cards under the question 'Does it have wheels?'
Count classroom pencils by color, then make a pictograph with one pencil sketch for each pencil.
Free download
Printable K.DA.A.15.a Worksheet
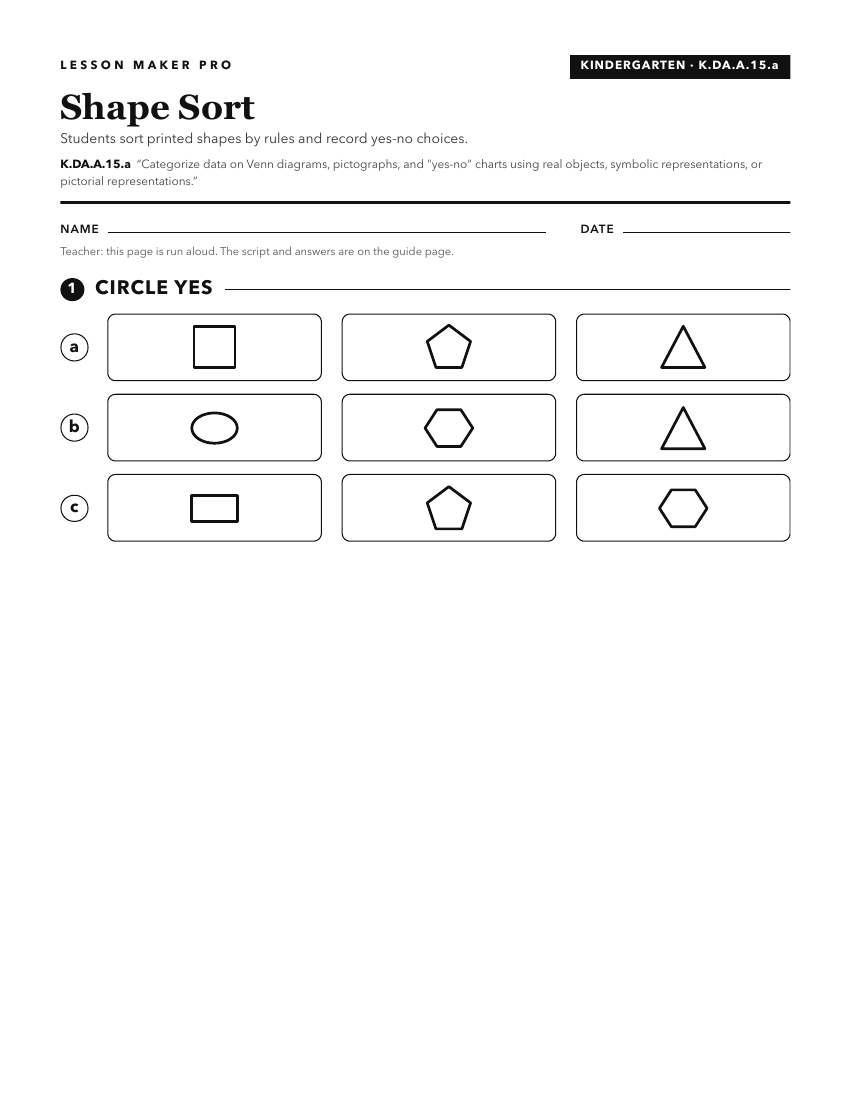
A ready-to-print activity worksheet aligned to K.DA.A.15.a, with an answer key for the teacher on its own page. No account needed.
PDF, US Letter, prints cleanly in black and white.
Download the worksheetKeep exploring
Related Standards
- 1.DA.A.16.b
Summarize data on Venn diagrams, pictographs, and "yes-no" charts using real objects, symbolic representations, or pictorial representations.
- 1.DA.A.16
Organize, represent, and interpret data with up to three categories.
- 6.DSP.A.24.b
Use graphical representations of real-world data to describe the context from which they were collected.
- 3.DA.A.16
For a given or collected set of data, create a scaled (one-to-many) picture graph and scaled bar graph to represent a data set with several categories.
Turn this exact standard into a lesson
Grade, subject, topic, and the complete standard are prefilled. Create one free, no account needed.
Also for this standard:Make a WorksheetMake a QuizMake a Sub Lesson