Alabama Math 3.DA.A.16
Standard Cluster
- 3.DA.A
- Represent and interpret data.
For a given or collected set of data, create a scaled (one-to-many) picture graph and scaled bar graph to represent a data set with several categories. a. Determine a simple probability from a context that includes a picture. b. Solve one- and two-step “how many more” and “how many less” problems using information presented in scaled graphs.
2019 Alabama Course of Study: Mathematics · Represent and interpret data.
Cluster contents
Standards in This Cluster
3.DA.A.16 is a cluster heading. These are the individual standards under it.
Teacher's field guide
What This Cluster Means
What Students Need to Do
- Students show counts for several groups on picture graphs and bar graphs, using a key such as one picture equals two votes. They use the scale to compare groups, sometimes adding two groups before finding the difference. They count items in a picture to find a simple chance.
What Mastery Looks Like
- A student labels both graphs and keeps the scale consistent. They read four bar steps on a twos scale as eight and combine groups before comparing. Given five pictured marbles, three red, they state the chance of red as 3 out of 5.
Common Misconceptions
- Students may count each picture or bar step as one, ignoring the key. They may subtract before adding two groups in a comparison. Some use the number of red marbles, rather than all the marbles, as the total when stating a chance.
How to Assess It
- On an exit ticket, give counts of 4 cats, 6 dogs, and 8 fish. Ask students to draw both graphs with a scale of two, compare dogs and fish together with cats, and find the chance of red from a drawing of three red and two blue marbles.
Lesson moves
Ways to Teach It
Give pairs 4 red, 6 blue, 8 green, and 10 yellow counters; have them draw both graphs using one picture or bar step for two counters.
Show a graph scaled by twos with 4 cats, 8 dogs, and 6 fish; ask students to explain how many more dogs and fish there are than cats.
Draw a bag with three red and two blue marbles; partners take turns naming a color and stating its chance as a fraction.
Post lunch counts for four days: 12, 14, 16, and 18; students graph them in twos and find the gap between busiest and quietest days.
Free download
Printable 3.DA.A.16 Worksheet
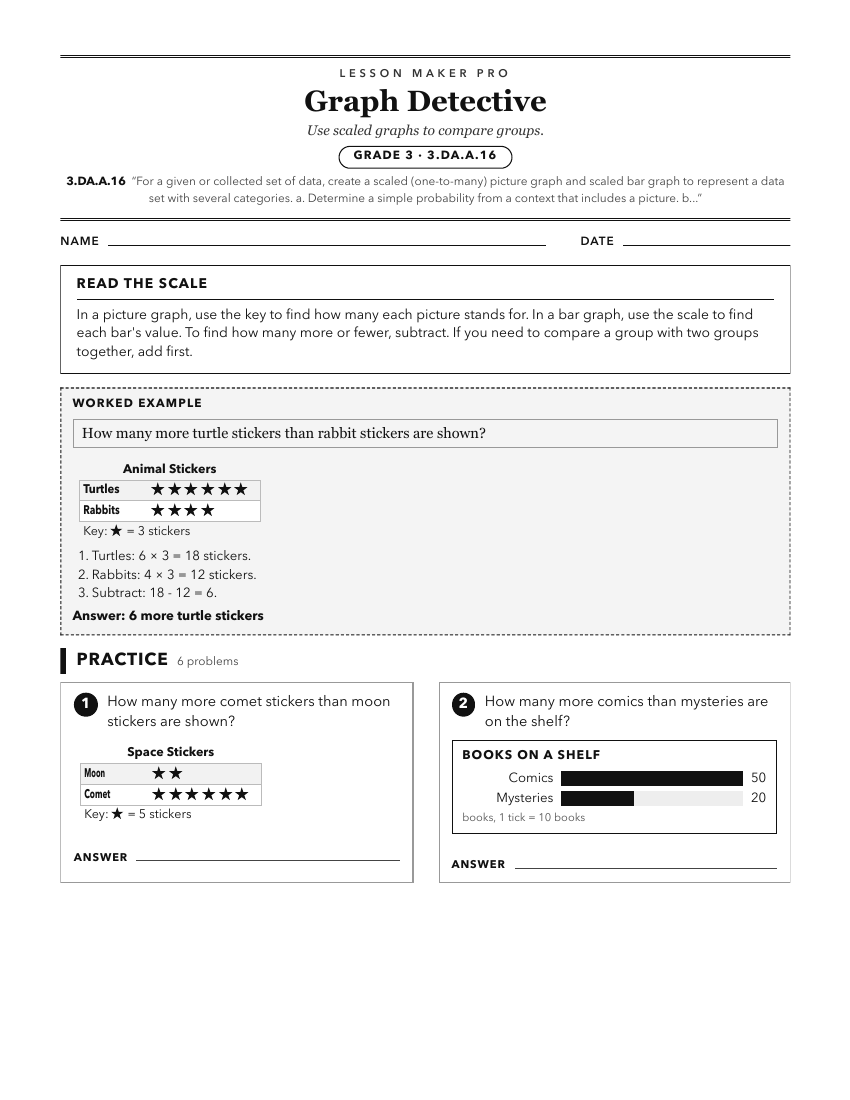
A ready-to-print activity worksheet aligned to 3.DA.A.16, with an answer key for the teacher on its own page. No account needed.
PDF, US Letter, prints cleanly in black and white.
Download the worksheetKeep exploring
Related Standards
- A1P.DSP.D.35.a
Summarize categorical data for two categories in two-way frequency tables and represent using segmented bar graphs.
- 8A.DSP.C.39.a
Summarize categorical data for two categories in two-way frequency tables and represent using segmented bar graphs.
- K.DA.A.15.a
Categorize data on Venn diagrams, pictographs, and "yes-no" charts using real objects, symbolic representations, or pictorial representations.
- 6.DSP.A.24.b
Use graphical representations of real-world data to describe the context from which they were collected.
Turn this cluster into a lesson
Grade, subject, topic, and the complete cluster are prefilled. Create one free, no account needed.
Also for this cluster:Make a WorksheetMake a QuizMake a Sub Lesson