Alabama Math 3.DA.A.16.b
The Standard
- 3.DA.A
- Represent and interpret data.
- 3.DA.A.16
- For a given or collected set of data, create a scaled (one-to-many) picture graph and scaled bar graph to represent a data set with several categories.
Solve one- and two-step “how many more” and “how many less” problems using information presented in scaled graphs.
2019 Alabama Course of Study: Mathematics · Represent and interpret data.
Teacher's field guide
What This Standard Means
What Students Need to Do
- Students use the scale to turn bars or picture symbols into counts. They compare two groups, or combine groups first and then find the difference.
What Mastery Looks Like
- A student reads bars that are 2, 4, and 5 squares tall on a graph where each square means 5. They use 10, 20, and 25 as the counts. They can find the difference between two groups or show that the first two together have 5 more than the third.
Common Misconceptions
- Students may count each square as one item and ignore the scale. In a two-step question, they may compare two bars and forget to include the third. They may also name the wrong group as having more.
How to Assess It
- Draw three bars with 4 apple squares, 3 orange squares, and 2 pear squares, where each square means 2 votes. Ask, “How many more votes did apples and oranges get together than pears? Show your math.”
Lesson moves
Ways to Teach It
Give pairs 4 tiles for dogs and 3 for cats, each tile worth 2 votes; have them build bars and find the difference.
Show bars 4 and 2 squares tall, with each square worth 5; ask, “Why is the difference 10, not 2?”
Play graph detective with a scale-of-3 graph and bars A, B, and C at 2, 4, and 5 squares; pairs swap and solve comparison questions.
Draw a cafeteria lunch graph with 4 pizza squares, 3 taco squares, and 2 sandwich squares worth 5 students each; compare combined choices.
Free download
Printable 3.DA.A.16.b Worksheet
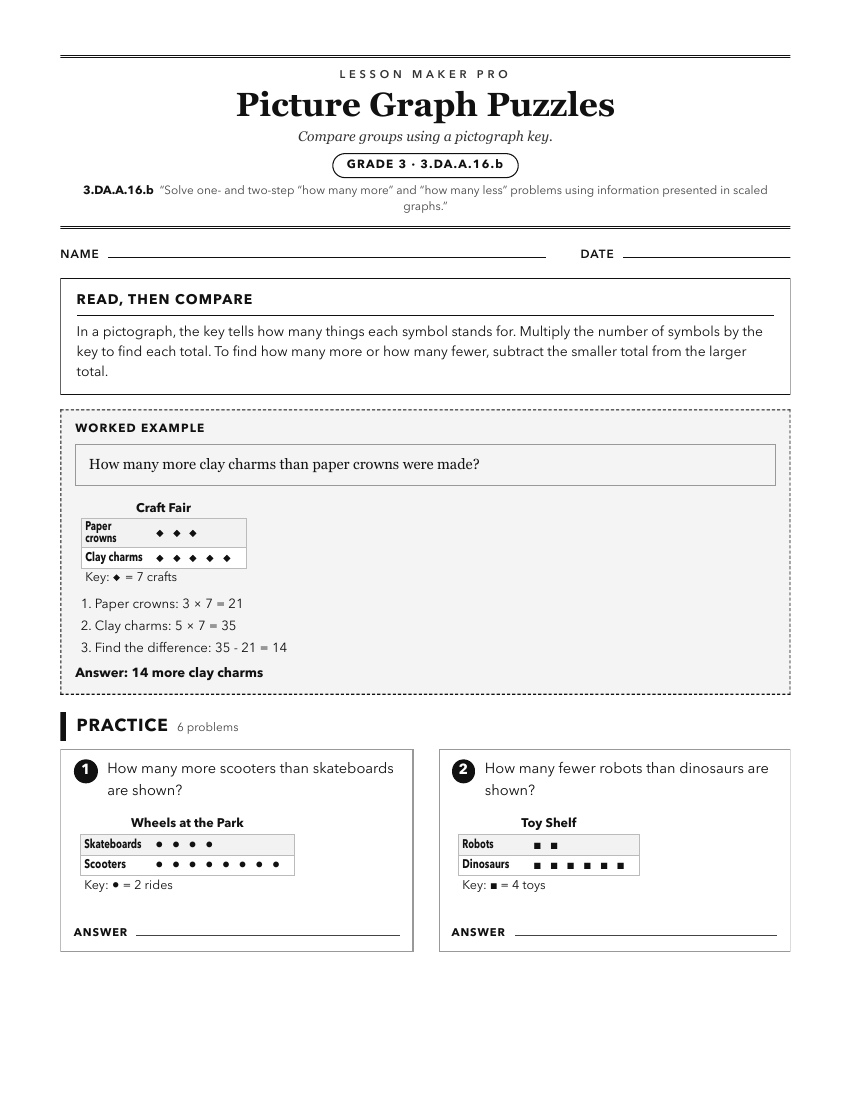
A ready-to-print activity worksheet aligned to 3.DA.A.16.b, with an answer key for the teacher on its own page. No account needed.
PDF, US Letter, prints cleanly in black and white.
Download the worksheetKeep exploring
Related Standards
- 2.OA.A.1
Use addition and subtraction within 100 to solve one- and two-step word problems by using drawings and equations with a symbol for the unknown number to represe...
- 5.DA.A.16.a
Add, subtract, multiply, and divide fractions to solve problems involving information presented in line plots.
- 1.DA.A.16.d
Determine "how many more" or "how many less" are in one category than in another using data organized into two or three categories.
- 4.OA.A.2
Solve word problems involving multiplicative comparison using drawings and write equations to represent the problem, using a symbol for the unknown number.
Turn this exact standard into a lesson
Grade, subject, topic, and the complete standard are prefilled. Create one free, no account needed.
Also for this standard:Make a WorksheetMake a QuizMake a Sub Lesson