Alabama Math 3.DA.A.16.a
The Standard
- 3.DA.A
- Represent and interpret data.
- 3.DA.A.16
- For a given or collected set of data, create a scaled (one-to-many) picture graph and scaled bar graph to represent a data set with several categories.
Determine a simple probability from a context that includes a picture.
2019 Alabama Course of Study: Mathematics · Represent and interpret data.
Teacher's field guide
What This Standard Means
What Students Need to Do
- Students look at a picture of objects that could be picked at random. They count the objects they want and the total, then describe the chance as “3 out of 8,” for example.
What Mastery Looks Like
- Given a picture of a bag with three blue marbles and five red marbles, a student says the chance of picking blue is 3 out of 8. They can point to the three blue marbles and all eight marbles to explain.
Common Misconceptions
- Students may say “3” is the chance because they counted only the blue marbles. Others count the two colors instead of all eight marbles and say the chance is 1 out of 2.
How to Assess It
- Sketch a bag with three blue circles and two red circles. Ask, “If you pick one without looking, what is the chance of picking blue? How do you know?”
Lesson moves
Ways to Teach It
Place four red and two blue counters on a mat, have students sketch them, then find the chance of picking blue without looking.
Show a drawing of a bag with five apple cards and one pear card. Ask, “Could you pick a pear? How likely is it?”
Give pairs picture cards of marble bags. Have them write the chance of picking red from each bag, then check each other’s counts.
Sketch a class prize jar with five pencil coupons and three sticker coupons. Ask students for the chance of drawing a sticker coupon.
Free download
Printable 3.DA.A.16.a Worksheet
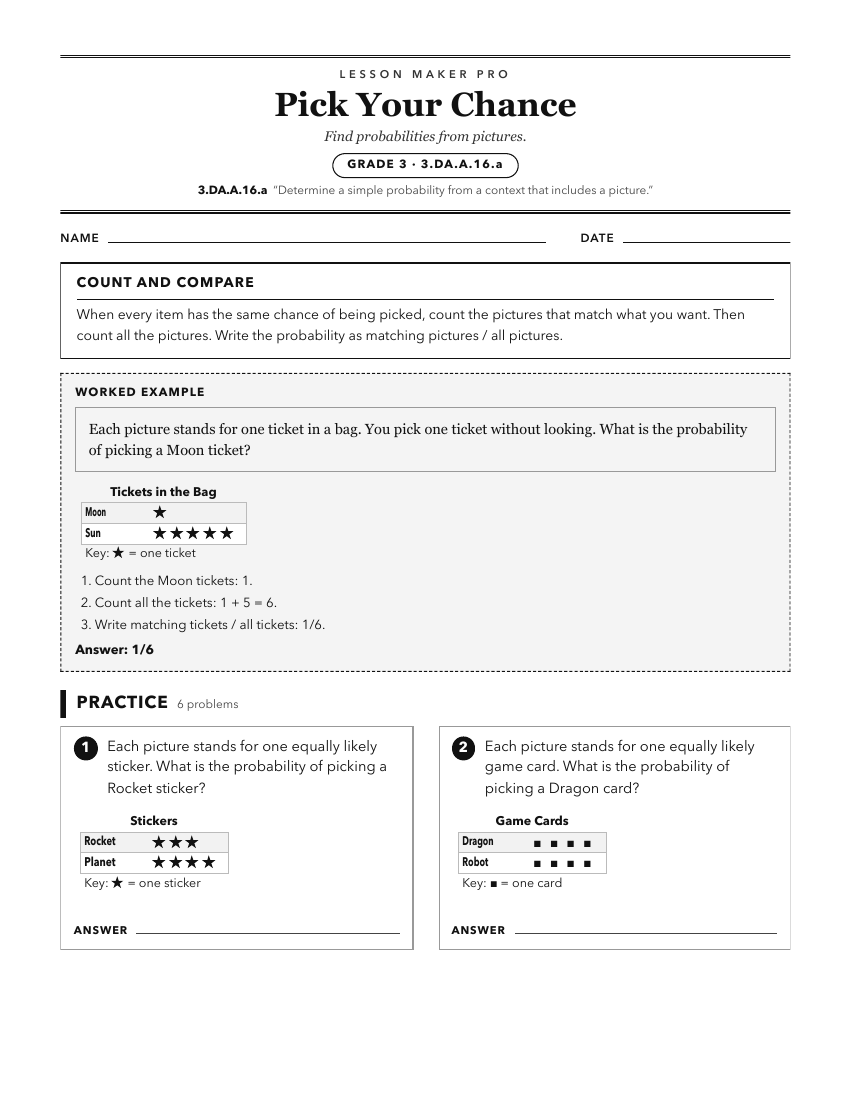
A ready-to-print activity worksheet aligned to 3.DA.A.16.a, with an answer key for the teacher on its own page. No account needed.
PDF, US Letter, prints cleanly in black and white.
Download the worksheetKeep exploring
Related Standards
- 7.DSP.C.13
Use a number from 0 to 1 to represent the probability of a chance event occurring, explaining that larger numbers indicate greater likelihood of the event occur...
- 7A.DSP.C.29
Use a number between 0 and 1 to represent the probability of a chance event occurring, explaining that larger numbers indicate greater likelihood of the event o...
Turn this exact standard into a lesson
Grade, subject, topic, and the complete standard are prefilled. Create one free, no account needed.
Also for this standard:Make a WorksheetMake a QuizMake a Sub Lesson