Alabama Math 6.DSP.A.24
Standard Cluster
- 6.DSP.A
- Use real-world and mathematical problems to analyze data and demonstrate an understanding of statistical variability and measures of center.
Represent numerical data graphically, using dot plots, line plots, histograms, stem and leaf plots, and box plots. a. Analyze the graphical representation of data by describing the center, spread, shape (including approximately symmetric or skewed), and unusual features (including gaps, peaks, clusters, and extreme values). b. Use graphical representations of real-world data to describe the context from which they were collected.
2019 Alabama Course of Study: Mathematics · Data Analysis, Statistics, and Probability
Cluster contents
Standards in This Cluster
6.DSP.A.24 is a cluster heading. These are the individual standards under it.
Teacher's field guide
What This Cluster Means
What Students Need to Do
- Students graph numerical data using dot plots, line plots, histograms, stem-and-leaf plots, and box plots. They describe typical values, spread, shape, gaps, clusters, peaks, and extreme values. They explain what those features mean in the data's real-world setting.
What Mastery Looks Like
- A student uses a clear scale, makes histogram bins that do not overlap, and places the median and quartiles correctly on a box plot. They can spot a cluster or a long tail in travel-time data and explain what it says about students' commutes.
Common Misconceptions
- Students may make histogram bars for individual values instead of intervals, or leave spaces between the bars. They may call the highest bar the median, or assume every box plot shows gaps and peaks. A long tail can also be mistaken for the side where most values fall.
How to Assess It
- Give students the values 5, 6, 6, 7, 8, 9, 10, 20 as minutes spent reading. Ask them to draw a dot plot, mark a typical value and the extreme value, and write what the graph says about reading time.
Lesson moves
Ways to Teach It
Measure 12 pencil lengths to the nearest centimeter, then build a floor dot plot with tape and sticky notes; describe its peak and range.
Show a travel-time histogram with four consecutive 10-minute bins holding 8, 6, 2, and 1 students; ask why it skews right.
Pairs race to plot 5, 6, 6, 7, 8, 8, 9, 10, 11, 12, 13, 20 five ways; compare where 20 appears.
Use 14 daily high temperatures from a local weather site; make a box plot and describe a typical day.
Free download
Printable 6.DSP.A.24 Worksheet
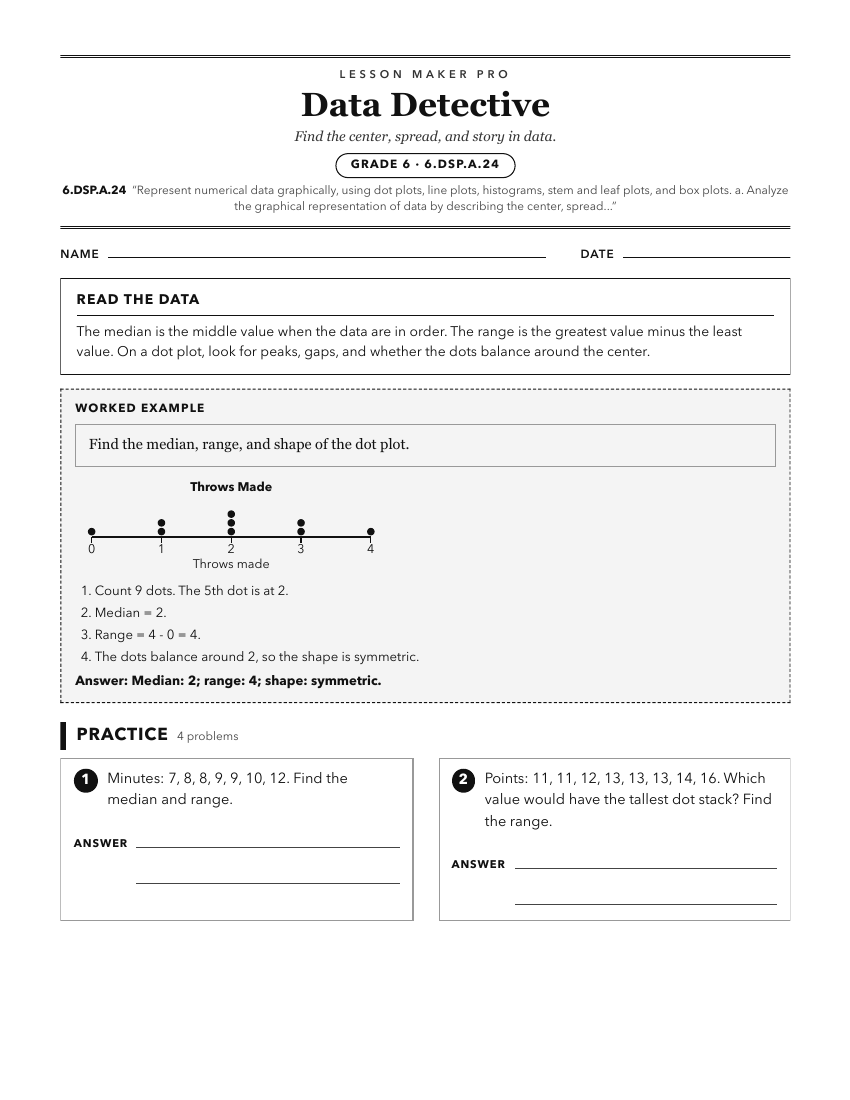
A ready-to-print activity worksheet aligned to 6.DSP.A.24, with an answer key for the teacher on its own page. No account needed.
PDF, US Letter, prints cleanly in black and white.
Download the worksheetKeep exploring
Related Standards
- GDA.DSP.C.9
Represent the distribution of univariate quantitative data with plots on the real number line, choosing a format (dot plot, histogram, or box plot) most appropr...
- 1.DA.A.16.b
Summarize data on Venn diagrams, pictographs, and "yes-no" charts using real objects, symbolic representations, or pictorial representations.
Turn this cluster into a lesson
Grade, subject, topic, and the complete cluster are prefilled. Create one free, no account needed.
Also for this cluster:Make a WorksheetMake a QuizMake a Sub Lesson