Alabama Math 6.DSP.A.24.a
The Standard
- 6.DSP.A
- Use real-world and mathematical problems to analyze data and demonstrate an understanding of statistical variability and measures of center.
- 6.DSP.A.24
- Represent numerical data graphically, using dot plots, line plots, histograms, stem and leaf plots, and box plots.
Analyze the graphical representation of data by describing the center, spread, shape (including approximately symmetric or skewed), and unusual features (including gaps, peaks, clusters, and extreme values).
2019 Alabama Course of Study: Mathematics
Teacher's field guide
What This Standard Means
What Students Need to Do
- Students read a dot plot or histogram to tell where most values fall and how much the values vary. They compare the two sides of the graph and use numbers from the axis to explain what they notice. They point out empty stretches, crowded areas, and values far from the rest.
What Mastery Looks Like
- Students can find a median and range from an unfamiliar graph. They can tell whether the graph is roughly balanced or has a longer tail on one side. They use values from the graph to identify a peak, cluster, gap, or lone value.
Common Misconceptions
- Students may mistake the tallest stack for the median, even when half the data fall elsewhere. They may call a graph symmetric because its peak is near the middle, despite a much longer tail on one side. A gap is a stretch with no data, not just space between tick marks.
How to Assess It
- Show a dot plot of 5, 10, 10, 15, 15, 15, 20, 20, 25, 30, and 55 minutes. Ask: "Give the median and range, name the shape, and use one gap or peak as evidence."
Lesson moves
Ways to Teach It
Use sticky notes to build a dot plot of these reading minutes: 10, 15, 15, 20, 20, 20, 25, 25, 30, 35, 60.
Ask students: "Is 20 or 60 minutes more typical for this group? Use the plot to explain."
Race teams to sort dot plot cards with counts 1,2,3,2,1; 4,3,2,1,1; and 1,1,2,3,4 into symmetric, right-skewed, and left-skewed.
Survey classmates' commute times, plot them, and tell whether a few long trips make the graph skewed.
Free download
Printable 6.DSP.A.24.a Worksheet
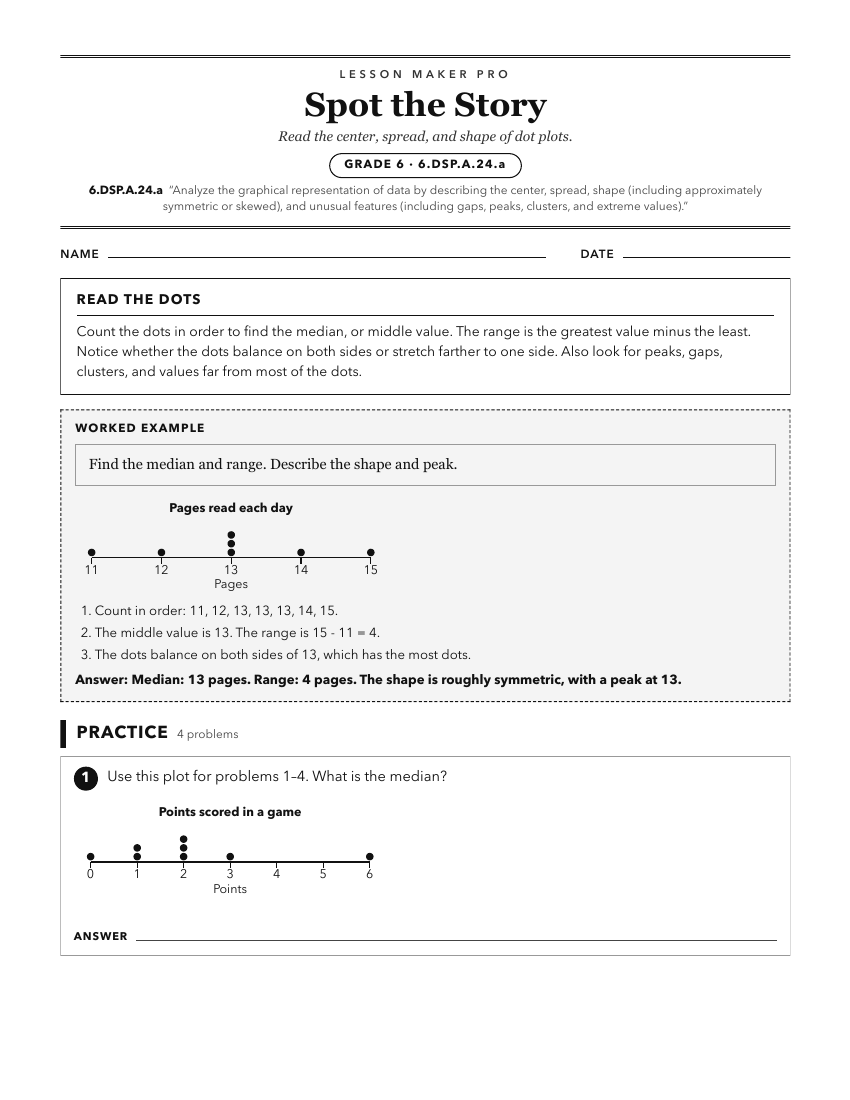
A ready-to-print activity worksheet aligned to 6.DSP.A.24.a, with an answer key for the teacher on its own page. No account needed.
PDF, US Letter, prints cleanly in black and white.
Download the worksheetKeep exploring
Related Standards
- GDA.DSP.C.11
Interpret differences in shape, center, and spread in the context of data sets, accounting for possible effects of extreme data points (outliers) on mean and st...
- 6.DSP.A.23
Calculate, interpret, and compare measures of center (mean, median, mode) and variability (range and interquartile range) in real-world data sets.
- GDA.DSP.C
Distributions of quantitative data (continuous or discrete) in one variable should be described in the context of the data with respect to what is typical (the ...
Turn this exact standard into a lesson
Grade, subject, topic, and the complete standard are prefilled. Create one free, no account needed.
Also for this standard:Make a WorksheetMake a QuizMake a Sub Lesson