Alabama Math GDA.DSP.C.11
The Standard
- GDA.DSP.C
- Distributions of quantitative data (continuous or discrete) in one variable should be described in the context of the data with respect to what is typical (the shape, with appropriate measures of center and variability, including standard deviation) and what is not (outliers), and these characteristics can be used to compare two or more subgroups with respect to a variable.
Interpret differences in shape, center, and spread in the context of data sets, accounting for possible effects of extreme data points (outliers) on mean and standard deviation.
2019 Alabama Course of Study: Mathematics
Teacher's field guide
What This Standard Means
What Students Need to Do
- Students compare data sets by describing their shape, typical value, and spread in context. They explain how an unusually high or low value affects the mean and standard deviation.
What Mastery Looks Like
- Given two commute-time dot plots, a student can identify the longer right tail and the set with more variable times. They can explain why one very long trip raises the mean and standard deviation while the median may stay the same.
Common Misconceptions
- Students may call the largest value an outlier even when it fits the pattern. They may think equal medians mean equal spread, or overlook how one extreme value changes standard deviation.
How to Assess It
- Exit ticket: Compare commute times of 10, 12, 14, 16, 18 minutes and 10, 12, 14, 16, 48 minutes. Sketch dot plots, find both means, and explain which set has greater spread and why.
Lesson moves
Ways to Teach It
Give pairs sticky notes marked 10, 12, 14, 16, 18; have them replace 18 with 48 and compare dot plots.
Ask students to write why a coach might report the median race time after one runner stops to tie a shoe.
Give partners dot plot cards and description cards; have them match each plot to its shape, center, and spread.
Compare cafeteria waits of 3, 4, 4, 5, and 19 minutes; have students choose a typical wait to post on a sign.
Free download
Printable GDA.DSP.C.11 Worksheet
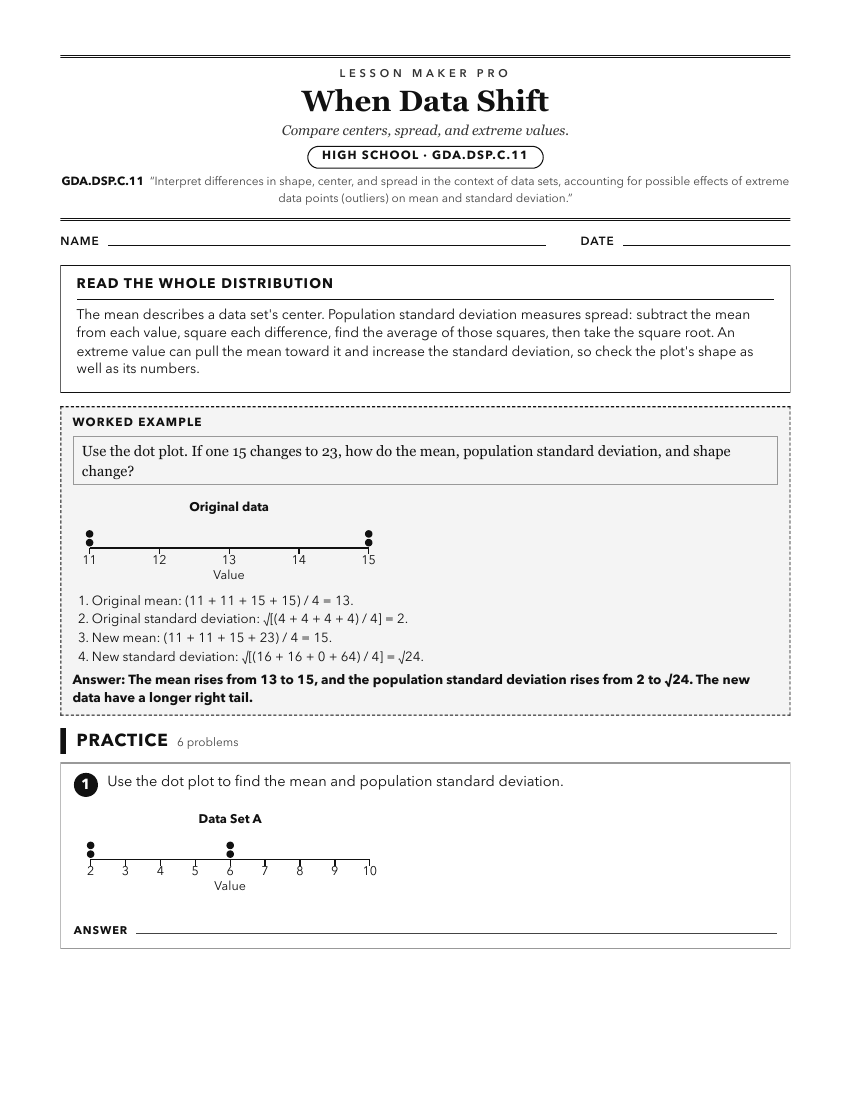
A ready-to-print activity worksheet aligned to GDA.DSP.C.11, with an answer key for the teacher on its own page. No account needed.
PDF, US Letter, prints cleanly in black and white.
Download the worksheetKeep exploring
Related Standards
- 6.DSP.A.24.a
Analyze the graphical representation of data by describing the center, spread, shape (including approximately symmetric or skewed), and unusual features (includ...
- 6.DSP.A.23
Calculate, interpret, and compare measures of center (mean, median, mode) and variability (range and interquartile range) in real-world data sets.
- 6.DSP.A.23.b
Interpret the measures of center and variability in the context of a problem.
Turn this exact standard into a lesson
Grade, subject, topic, and the complete standard are prefilled. Create one free, no account needed.
Also for this standard:Make a WorksheetMake a QuizMake a Sub Lesson