Alabama Math 6.DSP.A.23.b
The Standard
- 6.DSP.A
- Use real-world and mathematical problems to analyze data and demonstrate an understanding of statistical variability and measures of center.
- 6.DSP.A.23
- Calculate, interpret, and compare measures of center (mean, median, mode) and variability (range and interquartile range) in real-world data sets.
Interpret the measures of center and variability in the context of a problem.
2019 Alabama Course of Study: Mathematics
Teacher's field guide
What This Standard Means
What Students Need to Do
- Students find a measure of center, such as the mean or median, and a measure of spread, such as the range. They explain what each number says about the data, using the correct units.
What Mastery Looks Like
- A student can explain that a median of 12 minutes is the middle reading time and a range of 22 minutes is the gap between the shortest and longest times. They can notice when one unusually high value pulls the mean away from a typical result.
Common Misconceptions
- Students may report the range as the largest value instead of the difference between the largest and smallest values. They may treat the mean as everyone's result, or give a number without saying what it measures.
How to Assess It
- Exit ticket: Five students read for 10, 12, 12, 14, and 32 minutes. What do the median and range tell you about their reading times?
Lesson moves
Ways to Teach It
Cut paper strips for plant heights of 4, 5, 5, 6, and 12 centimeters; order them and label the median and range.
Ask: Five lunches cost $3, $4, $4, $5, and $12. Is the mean or median a better usual cost? Why?
Give pairs data cards and interpretation cards; have them match each set to its median and range statements, including units.
Post bus waits of 4, 5, 5, 6, and 18 minutes; ask which measure of center best describes a usual wait.
Free download
Printable 6.DSP.A.23.b Worksheet
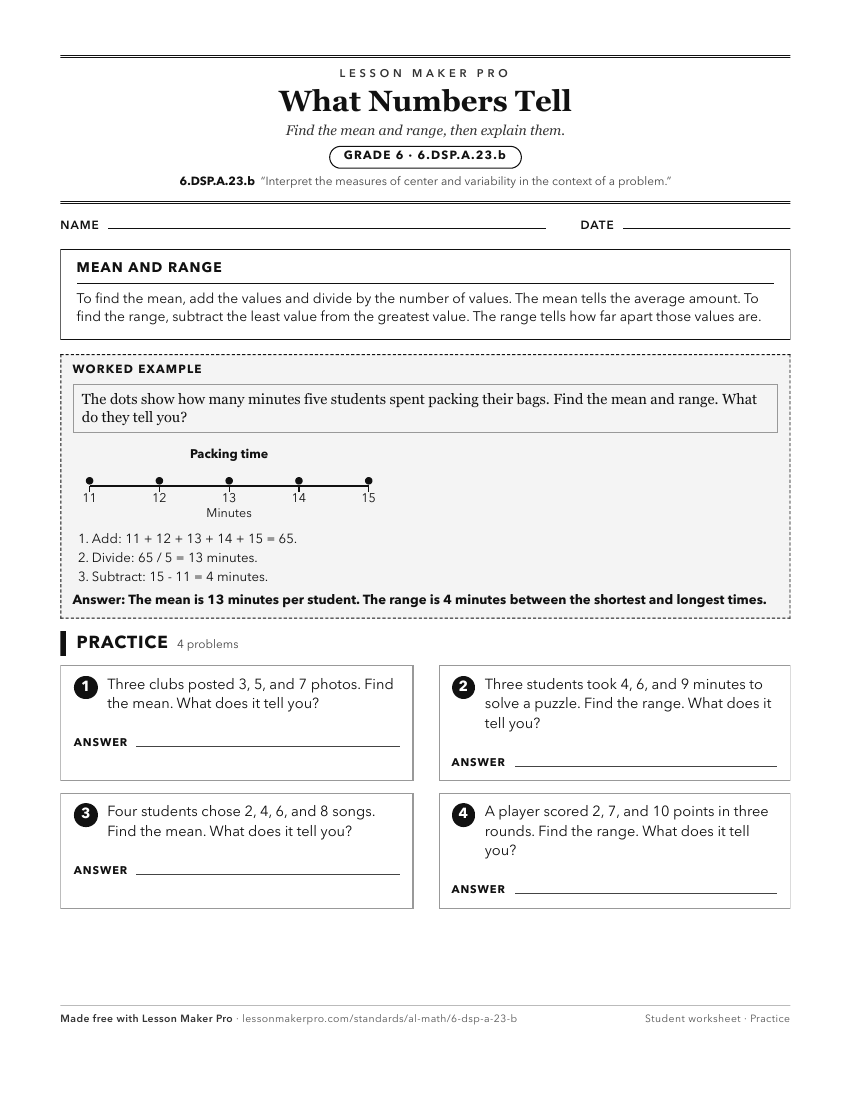
A ready-to-print activity worksheet aligned to 6.DSP.A.23.b, with an answer key for the teacher on its own page. No account needed.
PDF, US Letter, prints cleanly in black and white.
Download the worksheetKeep exploring
Related Standards
- 6.DSP.A.23
Calculate, interpret, and compare measures of center (mean, median, mode) and variability (range and interquartile range) in real-world data sets.
- 6.DSP.A
Use real-world and mathematical problems to analyze data and demonstrate an understanding of statistical variability and measures of center.
- 7A.DSP.B.28
Make informal comparative inferences about two populations using measures of center and variability and/or mean absolute deviation in context.
- 7.DSP.B.12
Make informal comparative inferences about two populations using measures of center and variability and/or mean absolute deviation in context.
Turn this exact standard into a lesson
Grade, subject, topic, and the complete standard are prefilled. Create one free, no account needed.
Also for this standard:Make a WorksheetMake a QuizMake a Sub Lesson