Alabama Math 6.DSP.A.23
Standard Cluster
- 6.DSP.A
- Use real-world and mathematical problems to analyze data and demonstrate an understanding of statistical variability and measures of center.
Calculate, interpret, and compare measures of center (mean, median, mode) and variability (range and interquartile range) in real-world data sets. a. Determine which measure of center best represents a real-world data set. b. Interpret the measures of center and variability in the context of a problem.
2019 Alabama Course of Study: Mathematics · Data Analysis, Statistics, and Probability
Cluster contents
Standards in This Cluster
6.DSP.A.23 is a cluster heading. These are the individual standards under it.
Teacher's field guide
What This Cluster Means
What Students Need to Do
- Students calculate the mean, median, mode, range, and interquartile range for real data. They compare the results, choose a useful measure of center, and explain what each number means in context.
What Mastery Looks Like
- Given bus wait times, a student sorts the values, calculates each measure, and labels the results in minutes. They choose the median when one long wait pulls the mean up and explain that the interquartile range describes the spread of the middle half.
Common Misconceptions
- Students may find quartiles without sorting the data or confuse the interquartile range with the full range. They may assume the mean always describes a typical value or that every data set has exactly one mode.
How to Assess It
- Exit ticket: Bus waits were 2, 3, 3, 4, 4, 4, 6, and 22 minutes. Find all five measures, then choose the best typical wait and explain why.
Lesson moves
Ways to Teach It
Give pairs cards marked 2, 3, 3, 4, 4, 4, 6, and 22 minutes; have them sort the cards and record five measures.
Write two sentences explaining whether 6 minutes or 4 minutes better describes a typical wait when one bus took 22 minutes.
Play a card match: pair 3, 3, 4, 4, 5, 6, 7, 20 with its mean, median, modes, range, and interquartile range.
Bring eight daily high temperatures from a weather site; students calculate range and interquartile range and explain what each says about temperature changes.
Free download
Printable 6.DSP.A.23 Worksheet
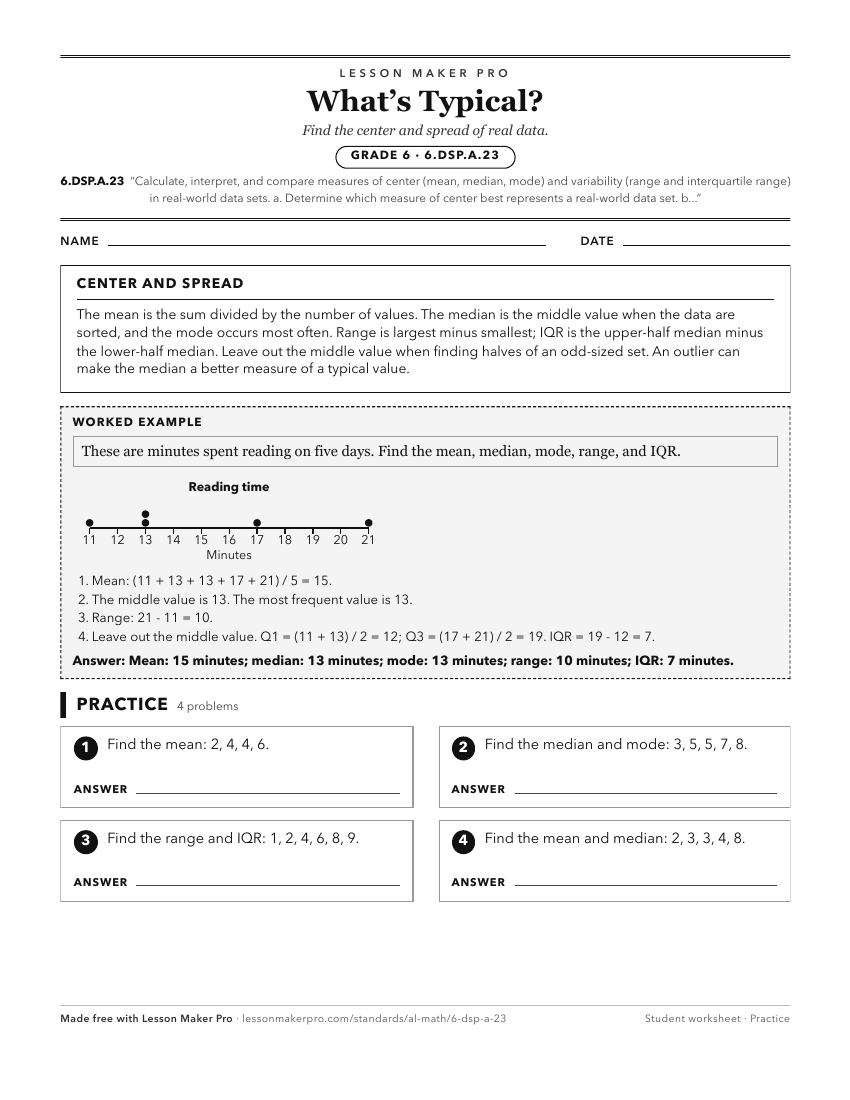
A ready-to-print activity worksheet aligned to 6.DSP.A.23, with an answer key for the teacher on its own page. No account needed.
PDF, US Letter, prints cleanly in black and white.
Download the worksheetKeep exploring
Related Standards
- 6.DSP.A
Use real-world and mathematical problems to analyze data and demonstrate an understanding of statistical variability and measures of center.
- MM.D3D.C.18.c
Find the mean, standard deviation, median, and interquartile range of a probability distribution and make long-term predictions about future possibilities. Dete...
Turn this cluster into a lesson
Grade, subject, topic, and the complete cluster are prefilled. Create one free, no account needed.
Also for this cluster:Make a WorksheetMake a QuizMake a Sub Lesson