Alabama Math 6.DSP.A.23.a
The Standard
- 6.DSP.A
- Use real-world and mathematical problems to analyze data and demonstrate an understanding of statistical variability and measures of center.
- 6.DSP.A.23
- Calculate, interpret, and compare measures of center (mean, median, mode) and variability (range and interquartile range) in real-world data sets.
Determine which measure of center best represents a real-world data set.
2019 Alabama Course of Study: Mathematics
Teacher's field guide
What This Standard Means
What Students Need to Do
- Students find the mean, median, and mode of real-world data. They decide which one best describes the data for a given question and explain their choice.
What Mastery Looks Like
- A student uses the mean when values are fairly even and the median when an extreme value pulls the mean away from most values. They use the mode when the question asks for the most common value.
Common Misconceptions
- Students may choose the mean every time, even when one high value skews it. Some find the median before sorting the numbers. Others choose the mode just because a value repeats, without checking whether it answers the question.
How to Assess It
- Exit ticket: Delivery times were 4, 5, 5, 6, and 25 minutes. Which better describes a typical delivery, mean or median? Calculate both and explain your choice.
Lesson moves
Ways to Teach It
Give pairs cards showing wait times of 5, 6, 6, 7, and 30 minutes; have them sort the cards and calculate the mean and median.
Ask students to write which center best describes home prices of $150k, $160k, $170k, $180k, and $600k, and explain why.
Play Center Match: give teams data cards and question cards, then have them match each question to a mean, median, or mode.
Show shoe sales by size, 6: 2, 7: 5, 8: 9, 9: 4, and ask which size a store should restock.
Free download
Printable 6.DSP.A.23.a Worksheet
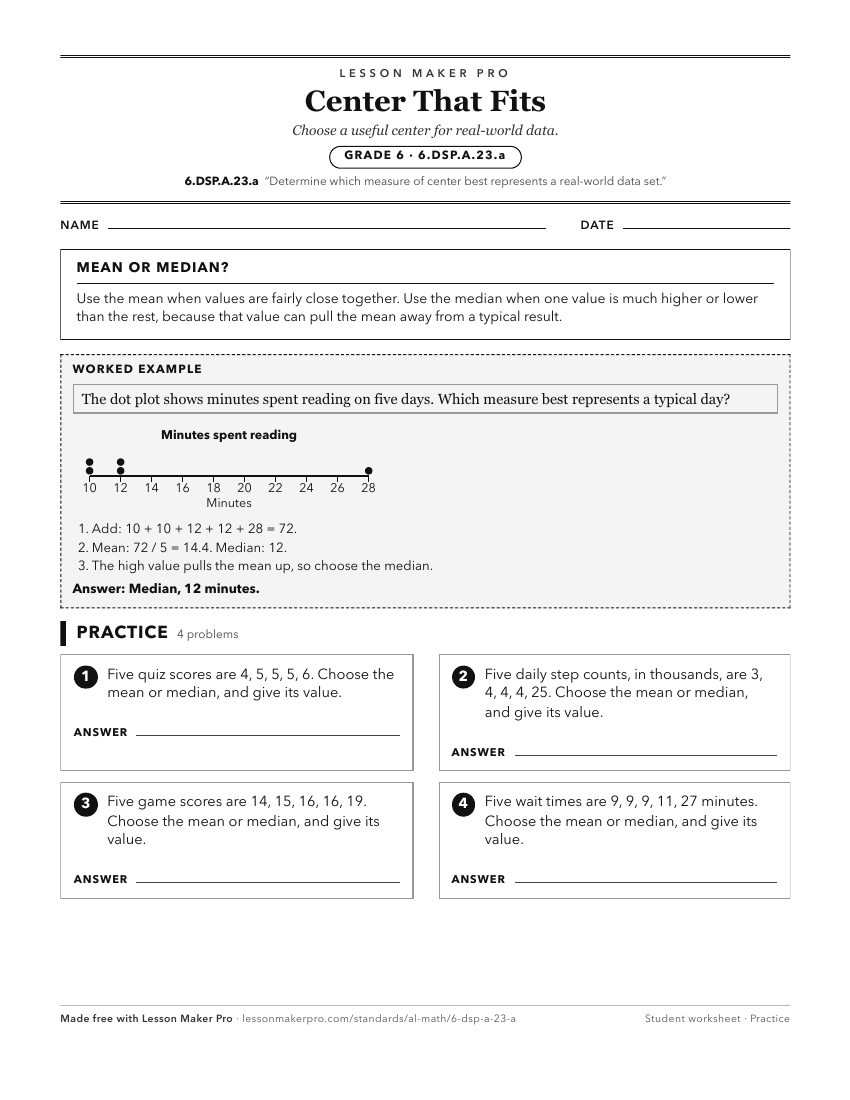
A ready-to-print activity worksheet aligned to 6.DSP.A.23.a, with an answer key for the teacher on its own page. No account needed.
PDF, US Letter, prints cleanly in black and white.
Download the worksheetKeep exploring
Related Standards
- 6.DSP.A.23
Calculate, interpret, and compare measures of center (mean, median, mode) and variability (range and interquartile range) in real-world data sets.
- 6.DSP.A
Use real-world and mathematical problems to analyze data and demonstrate an understanding of statistical variability and measures of center.
- 6.DSP.A.23.b
Interpret the measures of center and variability in the context of a problem.
- GDA.DSP.C.11
Interpret differences in shape, center, and spread in the context of data sets, accounting for possible effects of extreme data points (outliers) on mean and st...
Turn this exact standard into a lesson
Grade, subject, topic, and the complete standard are prefilled. Create one free, no account needed.
Also for this standard:Make a WorksheetMake a QuizMake a Sub Lesson