Alabama Math GDA.DSP.C.9
The Standard
- GDA.DSP.C
- Distributions of quantitative data (continuous or discrete) in one variable should be described in the context of the data with respect to what is typical (the shape, with appropriate measures of center and variability, including standard deviation) and what is not (outliers), and these characteristics can be used to compare two or more subgroups with respect to a variable.
Represent the distribution of univariate quantitative data with plots on the real number line, choosing a format (dot plot, histogram, or box plot) most appropriate to the data set, and represent the distribution of bivariate quantitative data with a scatter plot. Extend from simple cases by hand to more complex cases involving large data sets using technology.
2019 Alabama Course of Study: Mathematics
Teacher's field guide
What This Standard Means
What Students Need to Do
- Students show one set of numbers on a number line as a dot plot, histogram, or box plot. They put paired numbers on a scatter plot and use a spreadsheet for large data sets.
What Mastery Looks Like
- A student plots 12 scores by hand with a labeled scale and correct counts. They choose a histogram to see clusters or a box plot to summarize the spread of 100 scores. They use a spreadsheet to plot paired measurements with both axes labeled.
Common Misconceptions
- Students may leave gaps between histogram bars even when the intervals touch. They may think a box plot shows only five data points. They may separate paired measurements instead of plotting each pair as one point.
How to Assess It
- Give students paired commute distances in miles and times in minutes: (2,8), (3,9), (3,9), (4,10), (5,12), (5,12), (6,12), (8,15), (10,18), (12,22). Ask them to choose and draw a plot of the times, draw a scatter plot of the pairs, and explain their first choice.
Lesson moves
Ways to Teach It
Give pairs sticky notes labeled with bus ride times; have them stack the notes above a taped floor number line to make a dot plot.
Show a dot plot and box plot of 20 quiz scores; ask students which reveals repeated scores and which summarizes spread.
Give pairs three cards: 12 scores, 100 scores, and 20 paired heights and arm spans; have them choose plots and defend each choice.
Give students a spreadsheet of 100 paired commute distances and times; have them make a scatter plot and estimate travel time for 10 miles.
Free download
Printable GDA.DSP.C.9 Worksheet
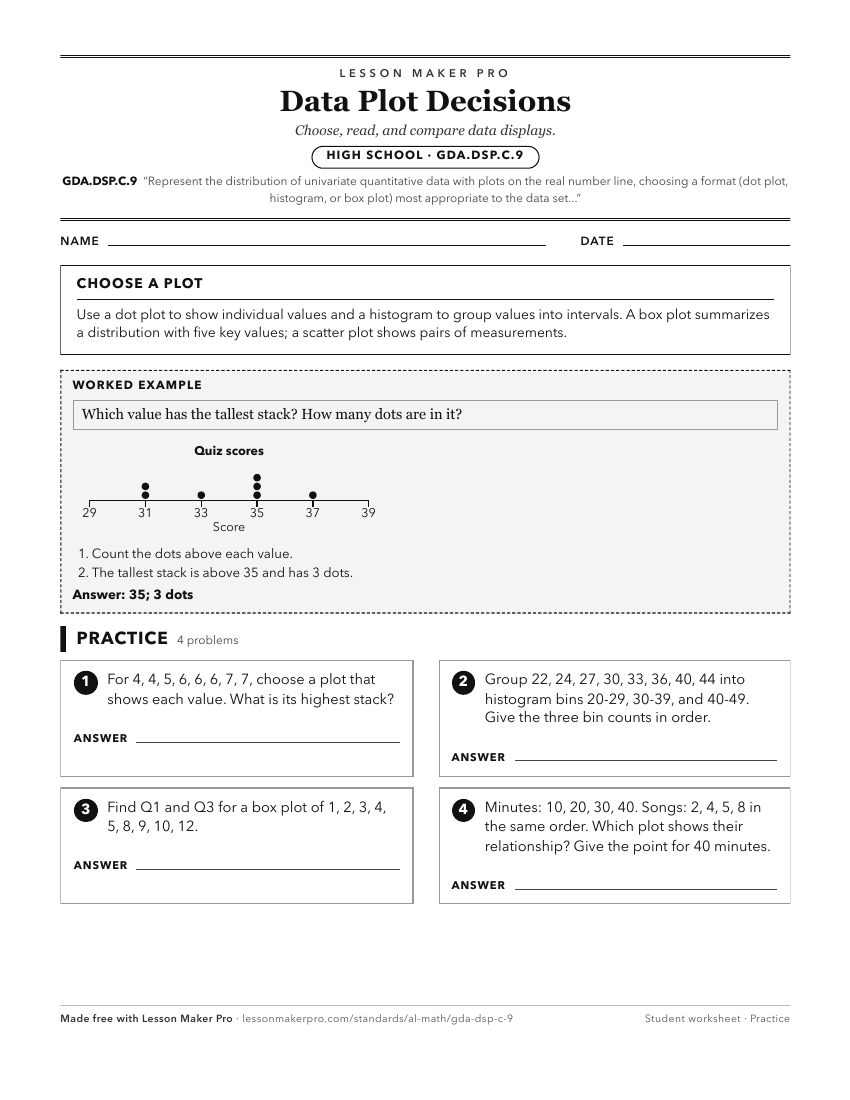
A ready-to-print activity worksheet aligned to GDA.DSP.C.9, with an answer key for the teacher on its own page. No account needed.
PDF, US Letter, prints cleanly in black and white.
Download the worksheetKeep exploring
Related Standards
Turn this exact standard into a lesson
Grade, subject, topic, and the complete standard are prefilled. Create one free, no account needed.
Also for this standard:Make a WorksheetMake a QuizMake a Sub Lesson